


python绘图 添加文字
Adding text to a plot is one of the most used features of matplotlib.pyplot and there is a function defined for this operation i.e. matplotlib.pyplot.text().
将文本添加到绘图是matplotlib.pyplot最常用的功能之一,并且为此操作定义了一个函数,即matplotlib.pyplot.text() 。
The following example shows the usage of this function.
以下示例显示了此功能的用法。


Reference: https://matplotlib.org/
参考: https : //matplotlib.org/
用于向绘图添加文本的Python代码 (Python code for adding text to the plot)
# Data Visualization using Python
# Adding Text
import numpy as np
import matplotlib.pyplot as plt
x = np.arange(50)
y1 = np.arange(50)
for i in range(50):
y1[i] = 2*x[i] + np.random.randint(0,5)
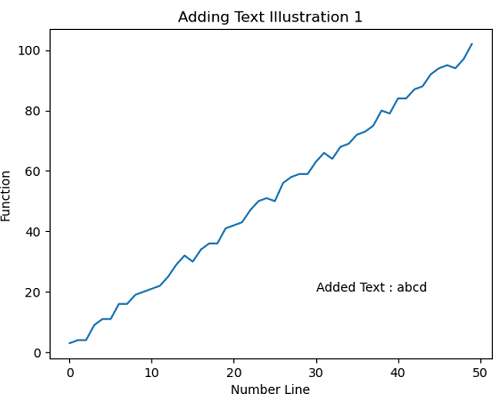
# Adding Text Illustration 1
plt.figure()
plt.plot(x,y1)
plt.xlabel('Number Line')
plt.ylabel('Function')
plt.title('Adding Text Illustration 1')
plt.text(30,20,'Added Text : abcd')
# Adding Text Illustration 2
plt.figure()
plt.plot(x,y1)
plt.xlabel('Number Line')
plt.ylabel('Function')
plt.title('Adding Text Illustration 2')
plt.text(30,20,'Added Text : abcd', fontsize=15)
# Adding Text Illustration 3
plt.figure()
plt.plot(x,y1)
plt.xlabel('Number Line')
plt.ylabel('Function')
plt.title('Adding Text Illustration 3')
plt.text(30,20,'Added Text : abcd', fontsize=15, color='g')
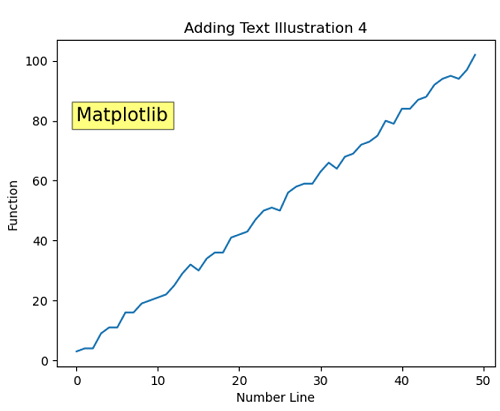
# Adding Text Illustration 4
plt.figure()
plt.plot(x,y1)
plt.xlabel('Number Line')
plt.ylabel('Function')
plt.title('Adding Text Illustration 4')
plt.text(0,80, 'Matplotlib', bbox=dict(facecolor='yellow', alpha=0.5), fontsize=15)
Output:
输出:
Output is as figure
翻译自: https://www.includehelp.com/python/adding-text-to-the-plot.aspx
python绘图 添加文字


 720
720

 被折叠的 条评论
为什么被折叠?
被折叠的 条评论
为什么被折叠?
 到【灌水乐园】发言


