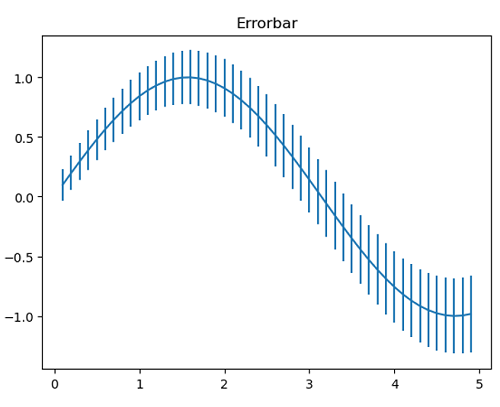
python 误差线
It is one of the most important aspects of plotting. Because of the huge application in experimental Data Visualization, matplotlib has provided a function matplotlib.pyplot.errorbar() for our desired operations.
这是绘图的最重要方面之一。 由于实验数据可视化中的大量应用,matplotlib为我们所需的操作提供了一个matplotlib.pyplot.errorbar()函数。


Python代码演示绘图中的错误栏示例 (Python code to demonstrate example of error-bar in plotting)
import numpy as np


 本文介绍了Python中使用matplotlib.pyplot.errorbar()函数进行误差线绘制的重要性及其在实验数据可视化中的广泛应用。通过代码示例展示了如何在绘图中添加误差线。
 最低0.47元/天 解锁文章


 1150
1150

 被折叠的 条评论
为什么被折叠?


