


- 🍨 本文为🔗365天深度学习训练营 中的学习记录博客
- 🍖 原作者:K同学啊
目标:
1.什么是随机森林(RF)
随机森林(Random Forest, RF)是一种由 决策树 构成的 集成算法 ,采用的是 Bagging 方法,他在很多情况下都能有不错的表现。其是由很多决策树构成的,不同决策树之间没有关联。当我们进行分类任务时,新的输入样本进入,就让森林中的每一棵决策树分别进行判断和分类,每个决策树会得到一个自己的分类结果,决策树的分类结果中哪一个分类最多,那么随机森林就会把这个结果当做最终的结果。个人理解:就是通过不维度去使用决策树去分类,每个决策树都有自己的分类结果 ,再把所有的结果进行统计,得出分类最多的那个分类就是预测的最终结果 。
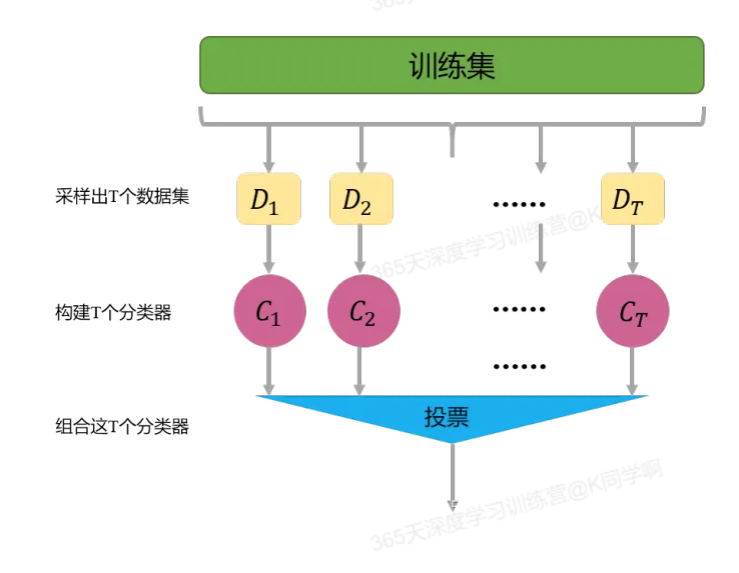
2. Bagging方法:Bagging的主要思想如下图所示,首先从数据集中采样出T个数据集,然后基于这T个数据集,每个训练出一个基分类器,再讲这些基分类器进行组合做出预测。Bagging在做预测时,对于分类任务,使用简单的投票法。对于回归任务使用简单平均法。若分类预测时出现两个类票数一样时,则随机选择一个。
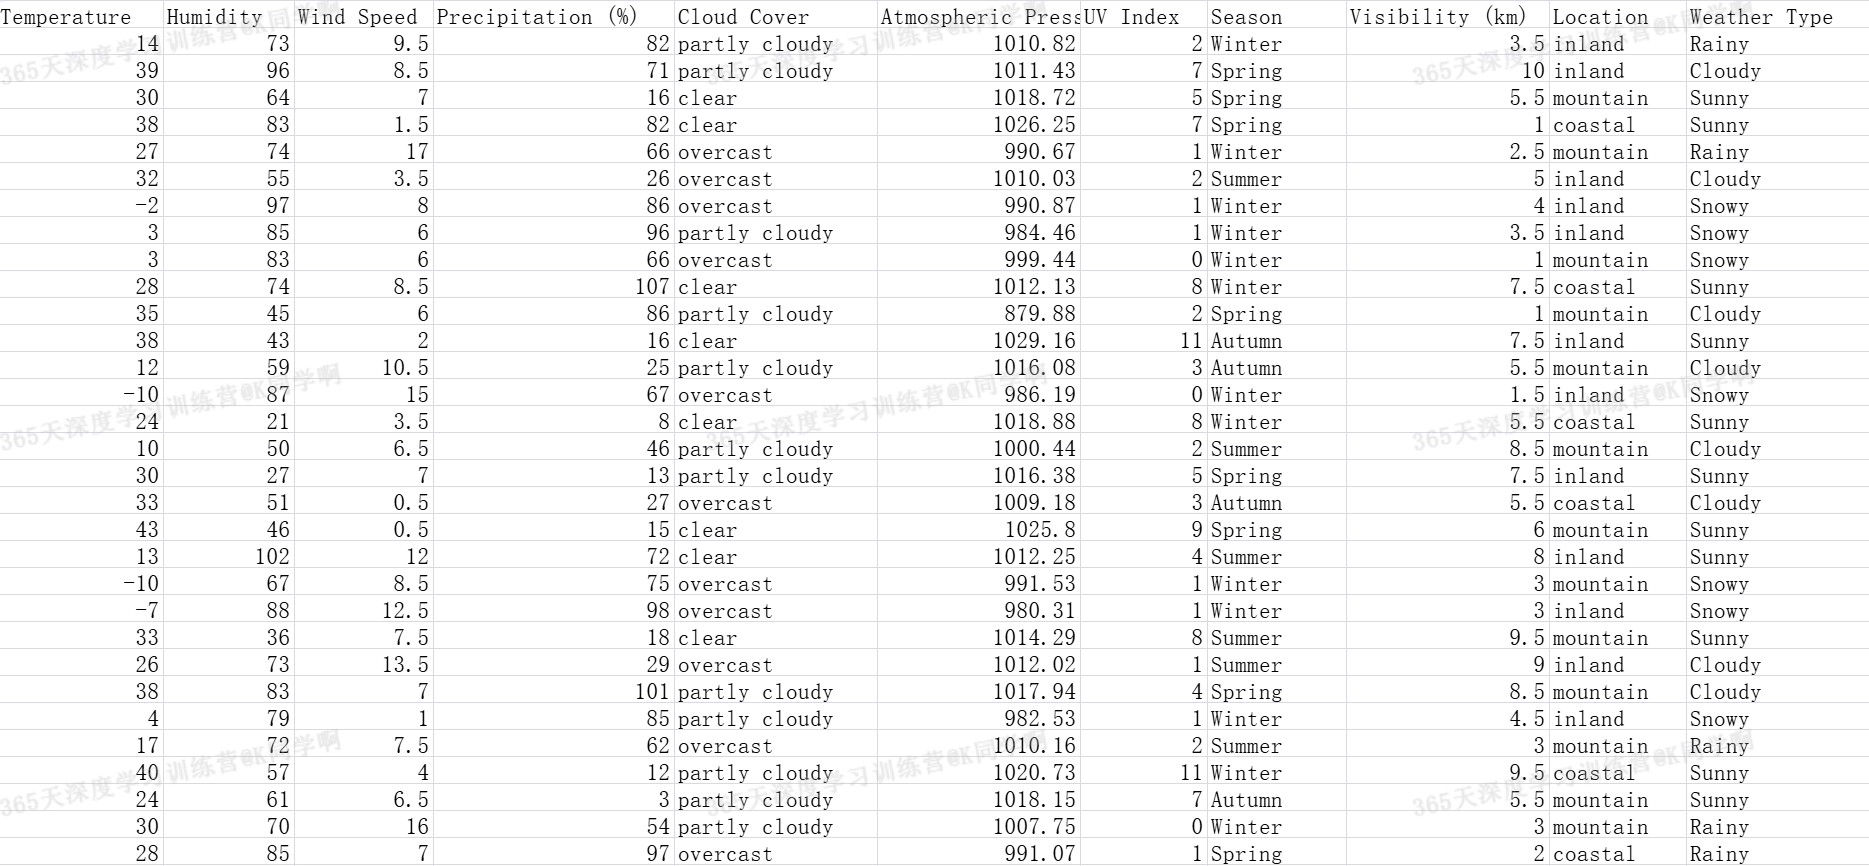
3.目标:从一个天气数据集去推送天气情况,这个天气数据集包含很多维度的数据,比如温度、温度、气压、风速、云量等等;
具体实现:
(一)环境:
语言环境:Python 3.10
编 译 器: PyCharm
**(二)具体步骤:
- 导入库:
import pandas as pd
import numpy as np
import seaborn as sns
import matplotlib.pyplot as plt
from sklearn.preprocessing import LabelEncoder
from sklearn.model_selection import train_test_split
from sklearn.ensemble import RandomForestClassifier
from sklearn.metrics import classification_report
- 导入数据:
data = pd.read_csv('./weather_classification_data.csv')
print(data)
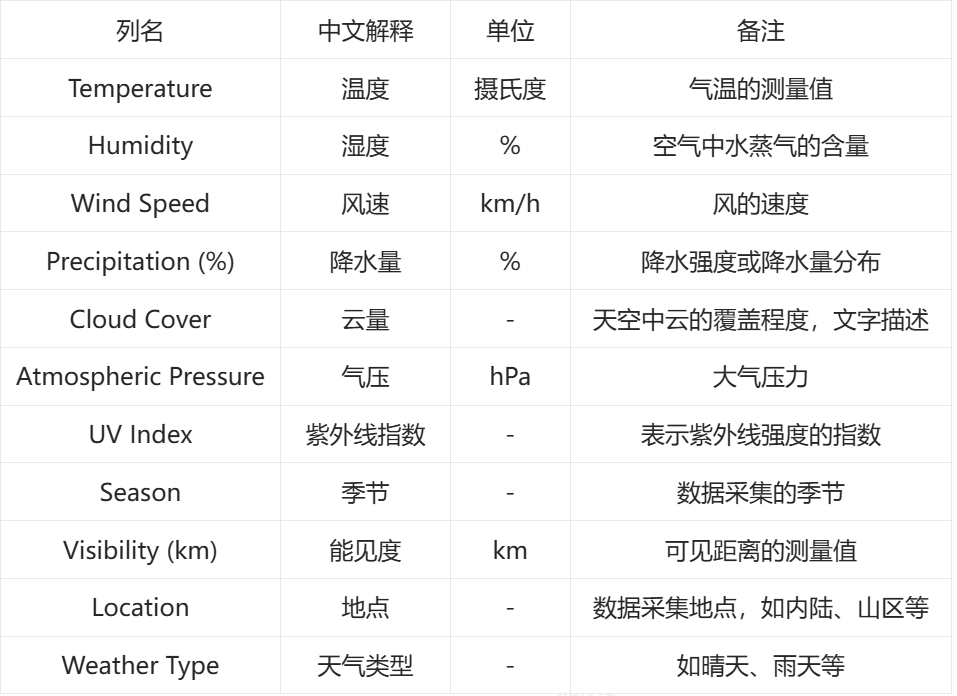
字段解释:
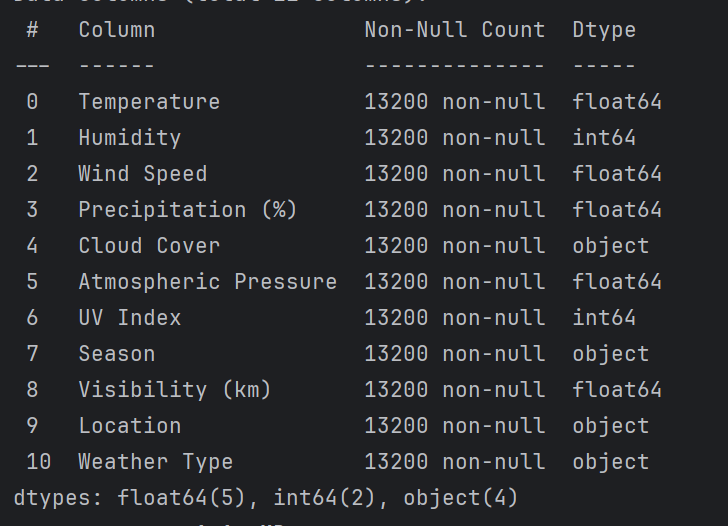
3. 查看数据信息:
# 数据检查和预处理
print(data.info())
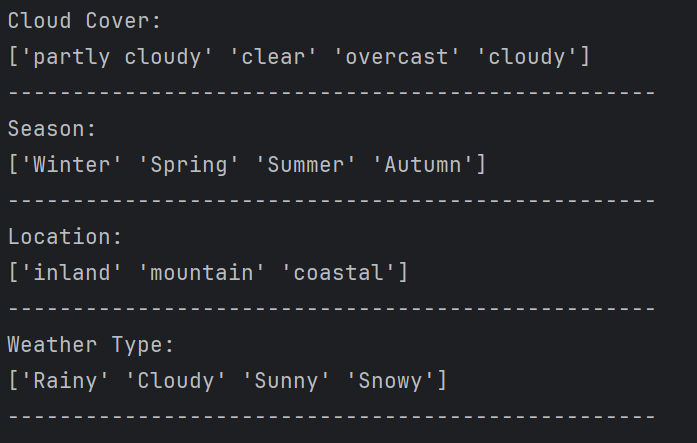
# 查看分类特征的唯一值
characteristic = ['Cloud Cover', 'Season', 'Location', 'Weather Type']
for i in characteristic:
    print(f'{i}:')
    print(data[i].unique())  # 过滤重复值
    print('-' * 50)
# 继续探索
feature_map = {
'Temperature': '温度',
'Humidity': '湿度百分比',
'Wind Speed': '风速',
'Precipitation (%)': '降水量百分比',
'Atmospheric Pressure': '大气压力',
'UV Index': '紫外线指数',
'Visibility (km)': '能见度'
}
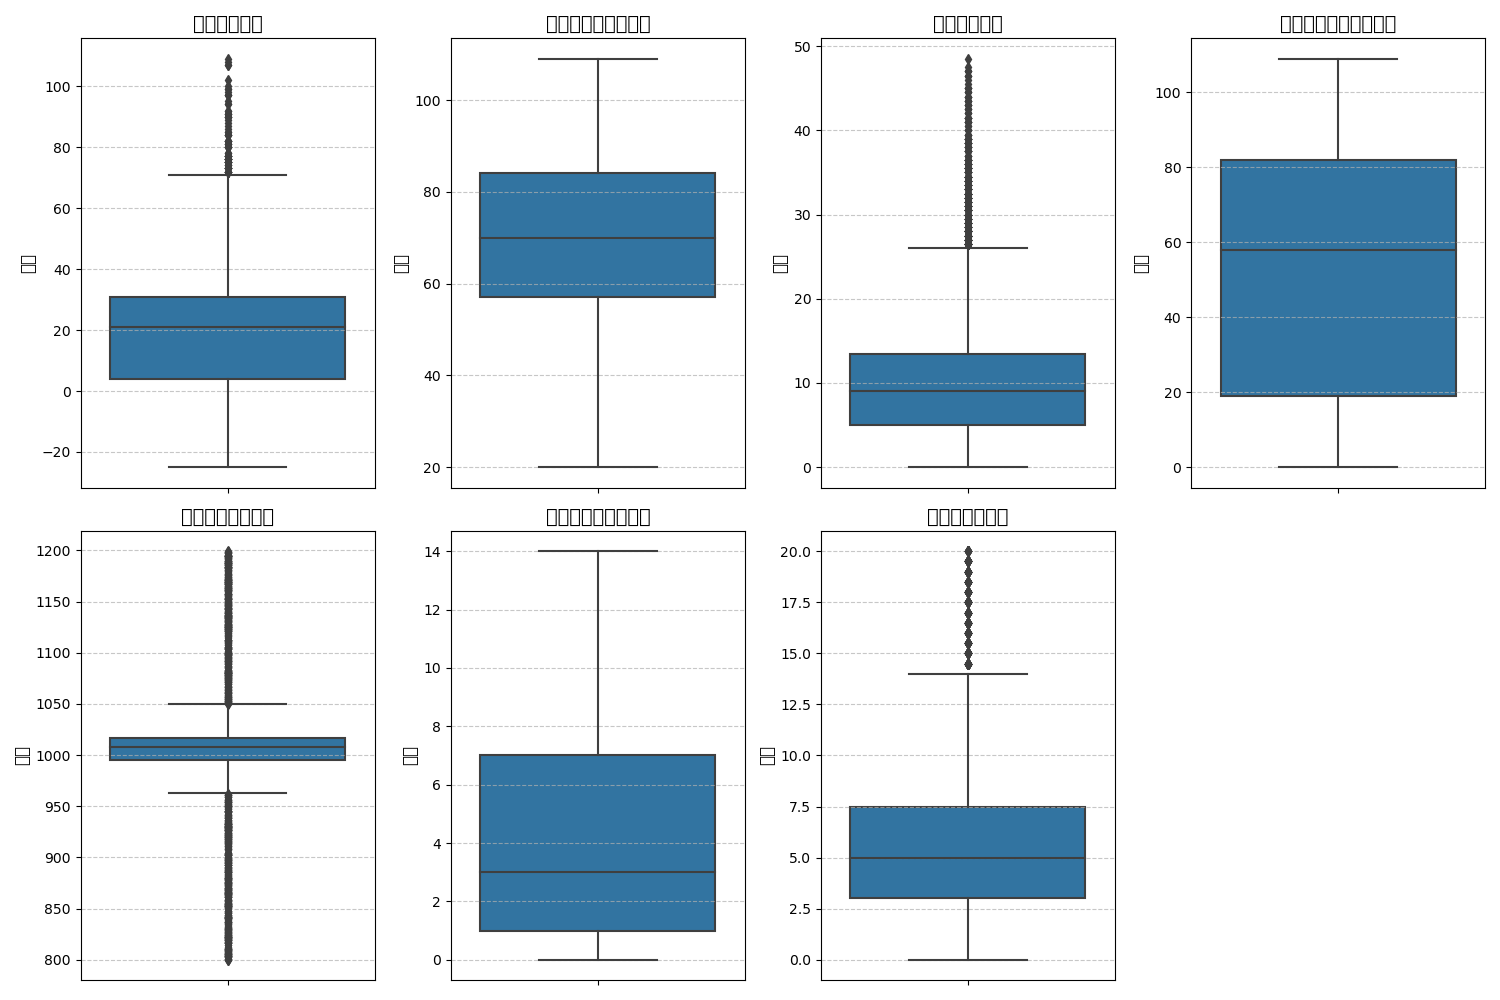
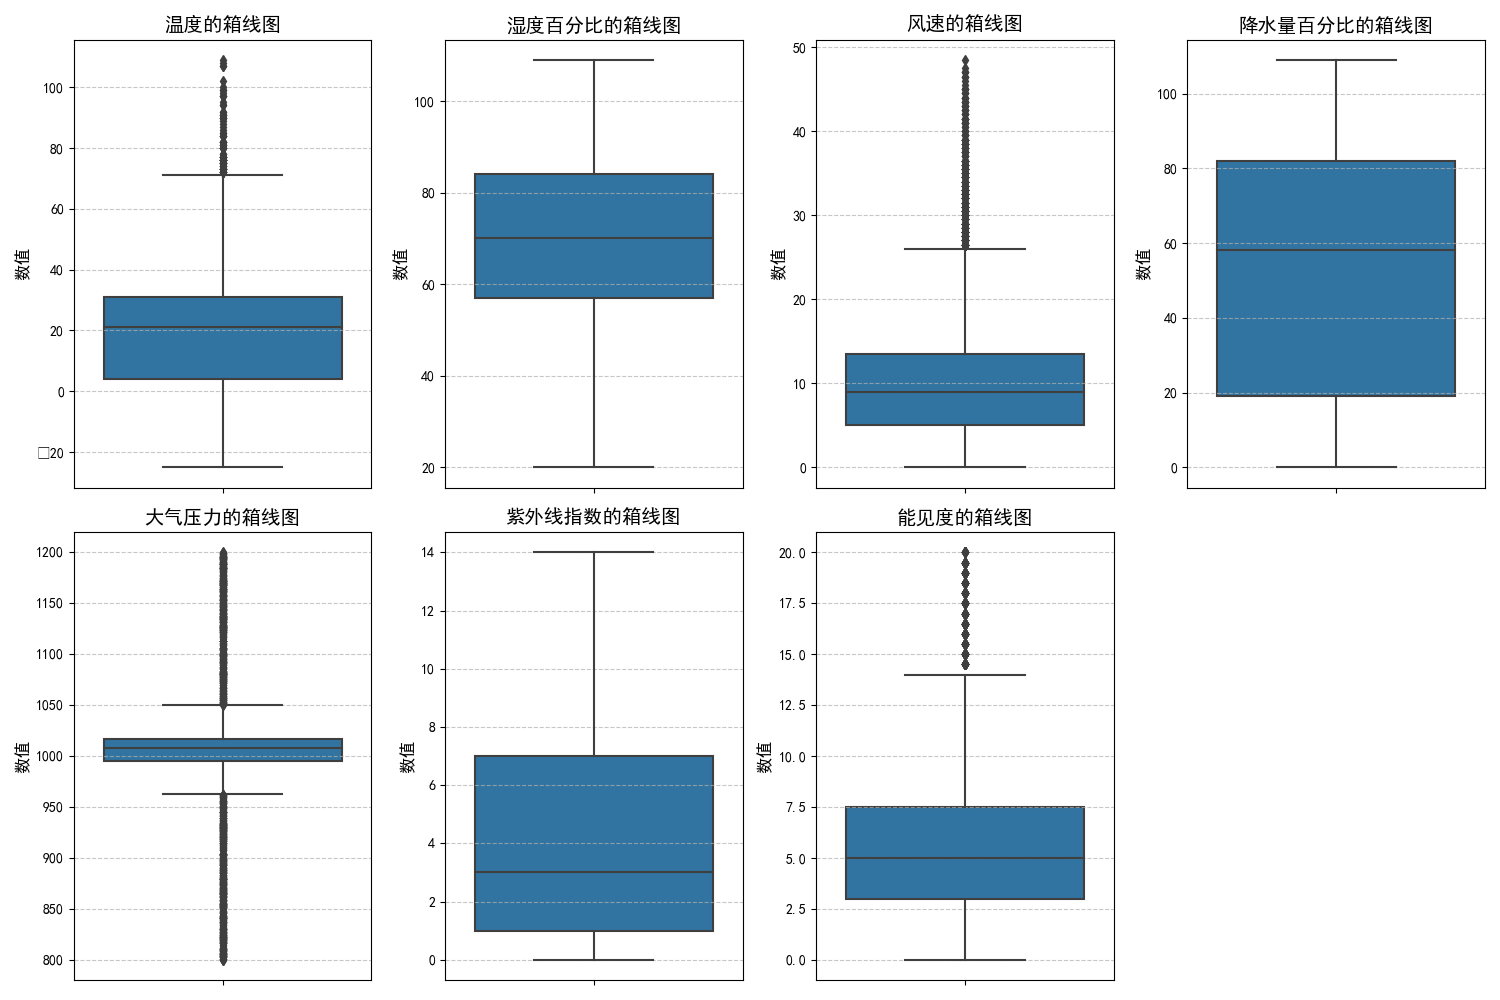
plt.figure(figsize=(15, 10))
for i, (col, col_name) in enumerate(feature_map.items(), 1):
plt.subplot(2, 4, i)
sns.boxplot(y=data[col])
plt.title(f'{col_name}的箱线图', fontsize=14)
plt.ylabel('数值', fontsize=12)
plt.grid(axis='y', linestyle='--', alpha=0.7)
plt.tight_layout()
plt.show()
注意:
- 如果出现“KeyError"的错误,请一定保证features_map中的key和数据中的列名一致,否则找不到。
- 如果出现如下图plt无法显示中文的情况:
请在代码中加入这两句(加哪里?自己琢磨一下),参考:python:matplotlib绘图无法显示中文或负号,显示为框框 - 范仁义 - 博客园:
plt.rcParams["font.sans-serif"] = ["SimHei"]
plt.rcParams["font.family"] = "sans-serif"
分析一下:
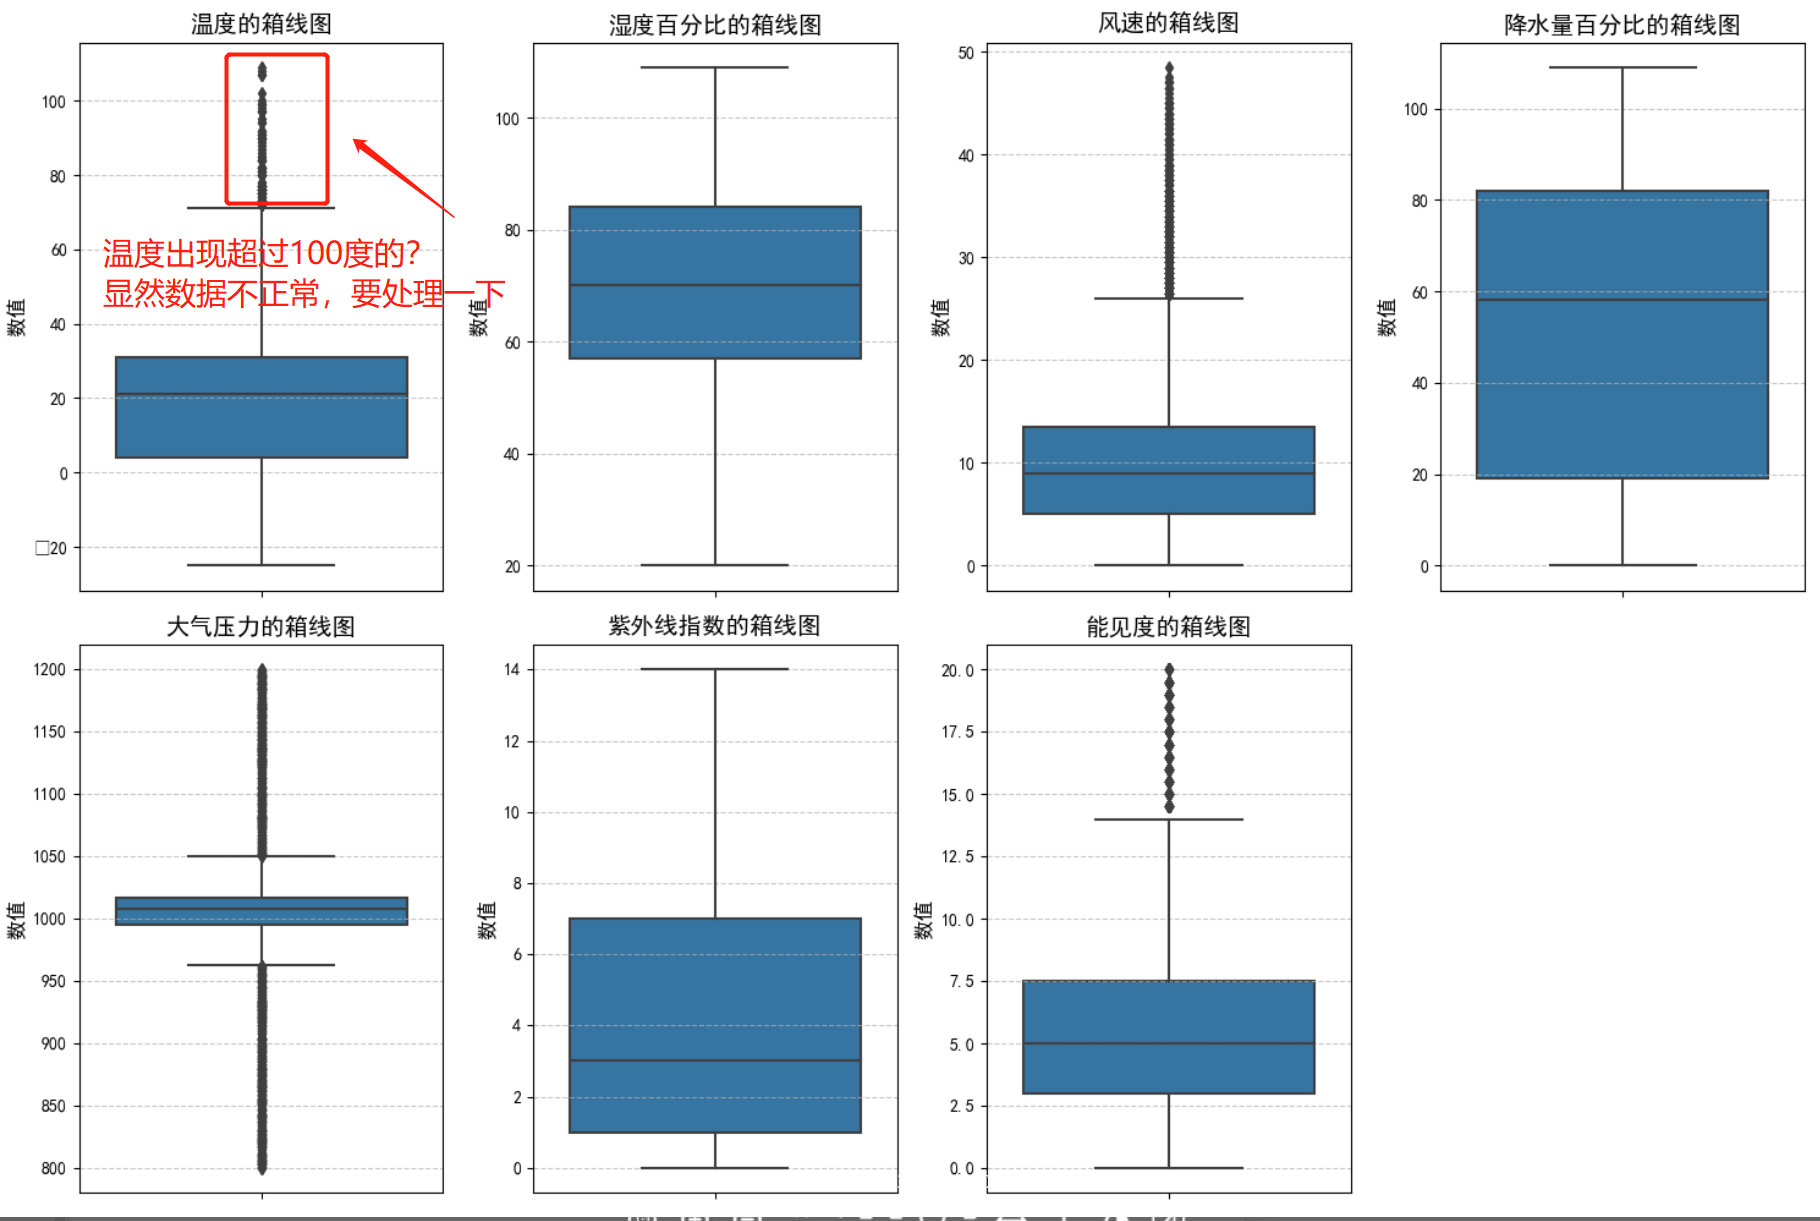
# 处理一下异常数据
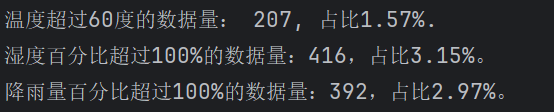
print(f"温度超过60度的数据量: {data[data['Temperature'] > 60].shape[0]}, 占比{round(data[data['Temperature']>60].shape[0] / data.shape[0] * 100, 2)}%.")
print(f"湿度百分比超过100%的数据量:{data[data['Humidity'] > 100].shape[0]},占比{round(data[data['Humidity'] > 100].shape[0] / data.shape[0] * 100,2)}%。")
print(f"降雨量百分比超过100%的数据量:{data[data['Precipitation (%)'] > 100].shape[0]},占比{round(data[data['Precipitation (%)'] > 100].shape[0] / data.shape[0] * 100,2)}%。")
异常数据有点高,把这些异常数据清除掉,以免影响整体训练效果:
# 处理一下异常数据,以免影响训练效果
print("删前的数据shape:", data.shape)
data = data[(data['Temperature'] <= 60) & (data['Humidity'] <= 100) & (data['Precipitation (%)'] <= 100)]
print("删后的数据shape:", data.shape)

- 随机森林预测
# 随机森林预测
new_data = data.copy()
label_encoders = {}
categorical_features = ['Cloud Cover', 'Season', 'Location', 'Weather Type']
for feature in categorical_features:
le = LabelEncoder()
new_data[feature] = le.fit_transform(data[feature])
label_encoders[feature] = le
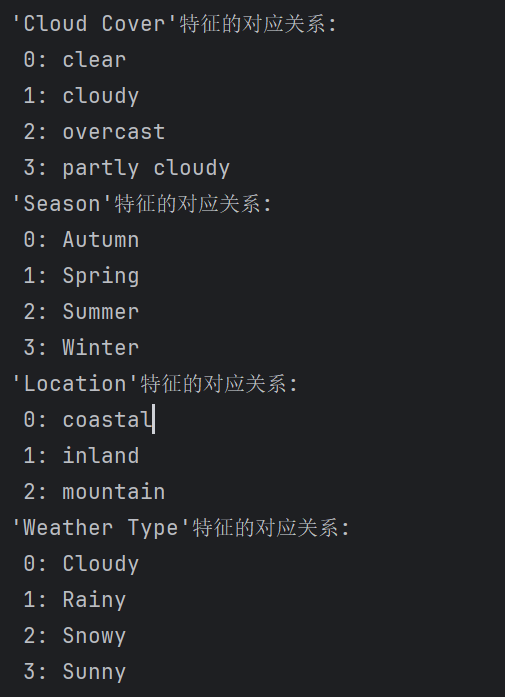
for feature in categorical_features:
print(f"'{feature}'特征的对应关系: ")
for index, class_ in enumerate(label_encoders[feature].classes_):
print(f" {index}: {class_}")
# 构建x, y
x = new_data.drop(['Weather Type'], axis=1)
y = new_data['Weather Type']

# 划分数据集
x_train, x_test, y_train, y_test = train_test_split(x, y, test_size=0.3, random_state=15)

# 构建RF模型
rf_clf = RandomForestClassifier(random_state=15)
rf_clf.fit(x_train, y_train)

# 使用RF进行预测
y_pred_rf = rf_clf.predict(x_test)
class_report_rf = classification_report(y_test, y_pred_rf)
print(class_report_rf)
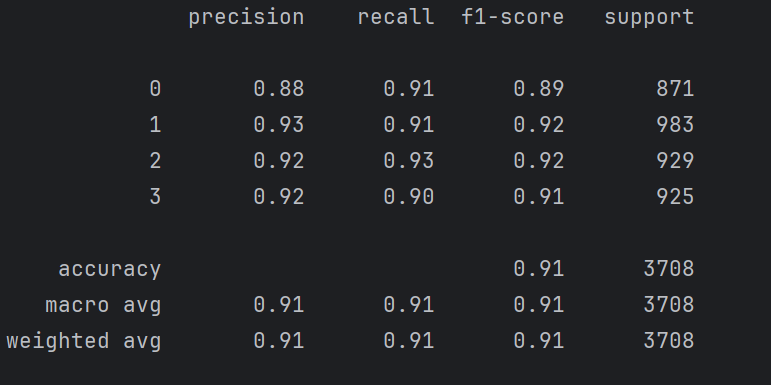
准确率还是很高。


 868
868

 被折叠的 条评论
为什么被折叠?
被折叠的 条评论
为什么被折叠?
 到【灌水乐园】发言


