


import matplotlib.pyplot as plt
import matplotlib.gridspec as gridspec

fig = plt.figure()

spec = gridspec.GridSpec(nrows=2, ncols=2, figure=fig)

ax1 = fig.add_subplot(spec[0,0])
ax3 = fig.add_subplot(spec[1,0])
ax4 = fig.add_subplot(spec[0,1])

plt.show()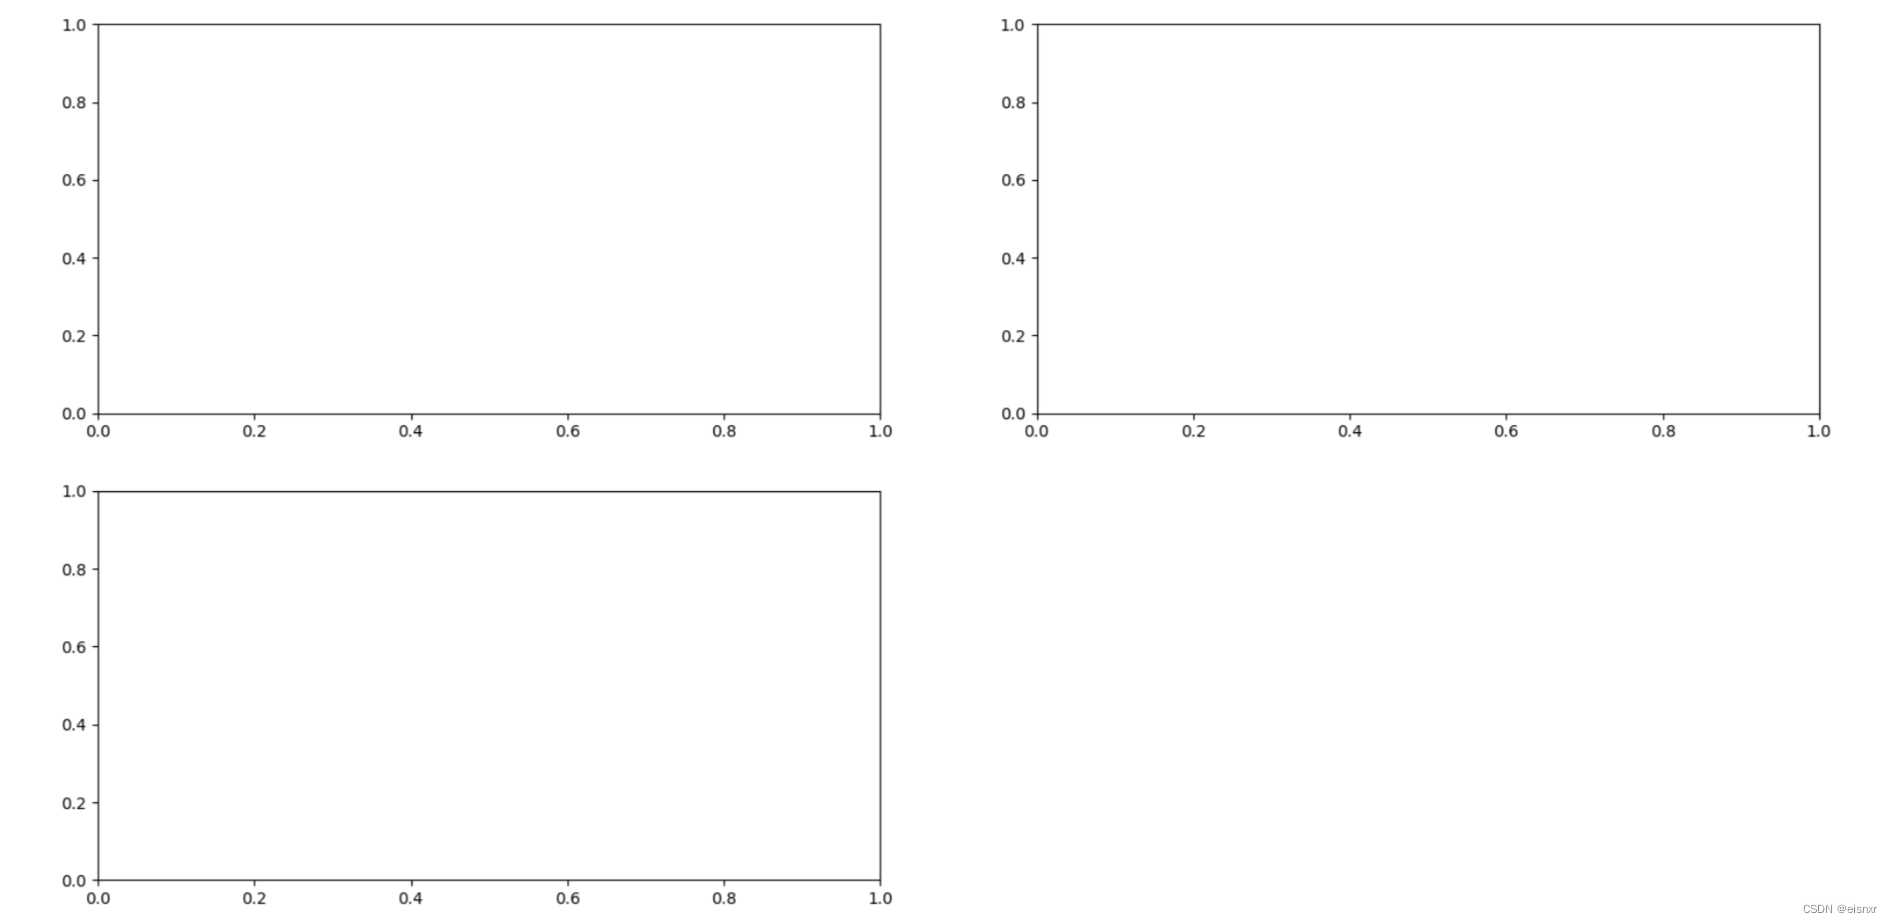
1.导入所需模块:
%matplotlib auto
#弹出窗绘图模式(将绘制的图表以弹出窗口的形式显示,支持用户交互、多种图片储存格式)

import numpy as np
import matplotlib.pyplot as plt
import matplotlib.gridspec as gridspec

#导入所需库
2.添加画布:
fig = plt.figure()3.创建“区域规划图”实例:
spec = gridspec.GridSpec(nrows=2, ncols=2, figure=fig)4.根据给定的Gridspec实例,创建对应的坐标系实例:
ax1 = fig.add_subplot(spec[0,0]) #二维数组的切片
#ax2 = fig.add_subplot(spec2[0,1]) 二维数组的索引
ax3 = fig.add_subplot(spec2[1,0])
ax4 = fig.add_subplot(spec2[0,1])
在Gridspec中使用width_ratios和height_ratios参数.
import matplotlib.pyplot as plt
import matplotlib.gridspec as gridspec
fig2 = plt.figure(constrained_layout=True)
widths = [2,3,1.5]
heights = [1,3,2]
spec2 = fig2.add_gridspec(ncols=3, nrows=3, width_ratios=widths, height_ratios=heights)
for row in range(3):
for col in range(3):
ax = fig2.add_subplot(spec2[row, col])
label = 'Width: {}\nHeight: {}'.format(widths[col], heights[row])
ax.annotate(label, (0.1, 0.5), xycoords='axes fraction', va='center')
plt.show()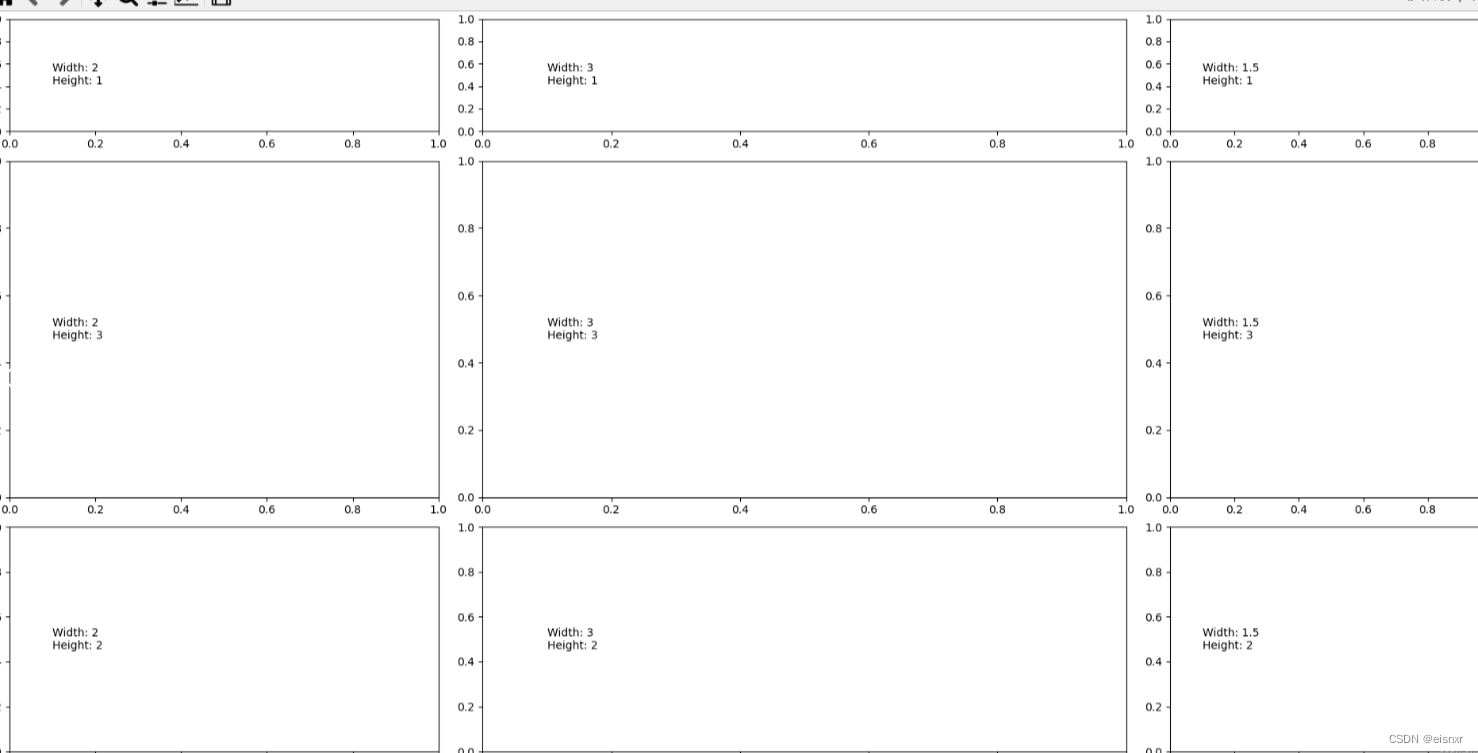 精细调整Gridspec布局
%matplotlib auto
import numpy as np
import matplotlib.pyplot as plt
import matplotlib.gridspec as gridspec

fig3 = plt.figure(constrained_layout=False)
gs1 = fig3.add_gridspec(nrows=3,ncols=3,left=0.05,right=0.48,wspace=0.05)
f3_ax1 = fig3.add_subplot(gs1[:-1,:])
f3_ax2 = fig3.add_subplot(gs1[-1,:-1])
f3_ax3 = fig3.add_subplot(gs1[-1,-1])

plt.show()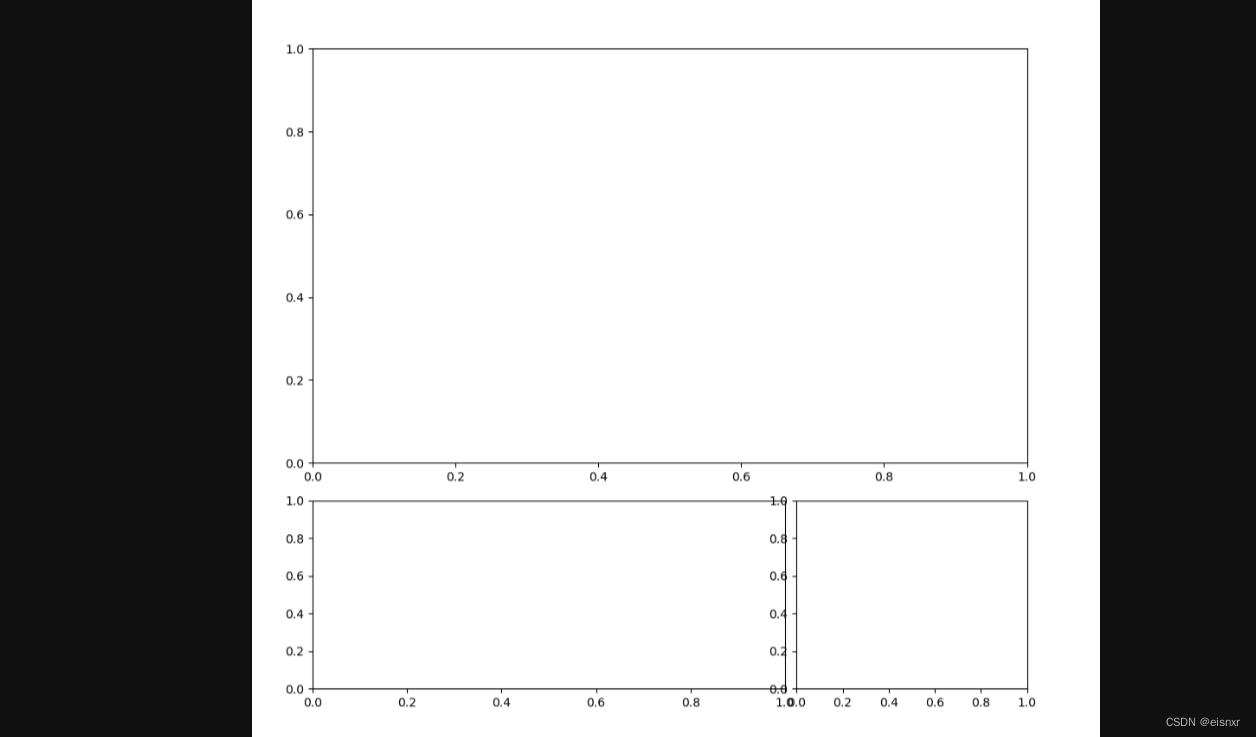


 2335
2335

 被折叠的 条评论
为什么被折叠?
被折叠的 条评论
为什么被折叠?
 到【灌水乐园】发言


