


摘自Online Appendix for Exports and Credit Constraints under Incomplete Information: Theory and Evidence from China
http://mjyu.ccer.edu.cn/RESTAT_appendix.pdf
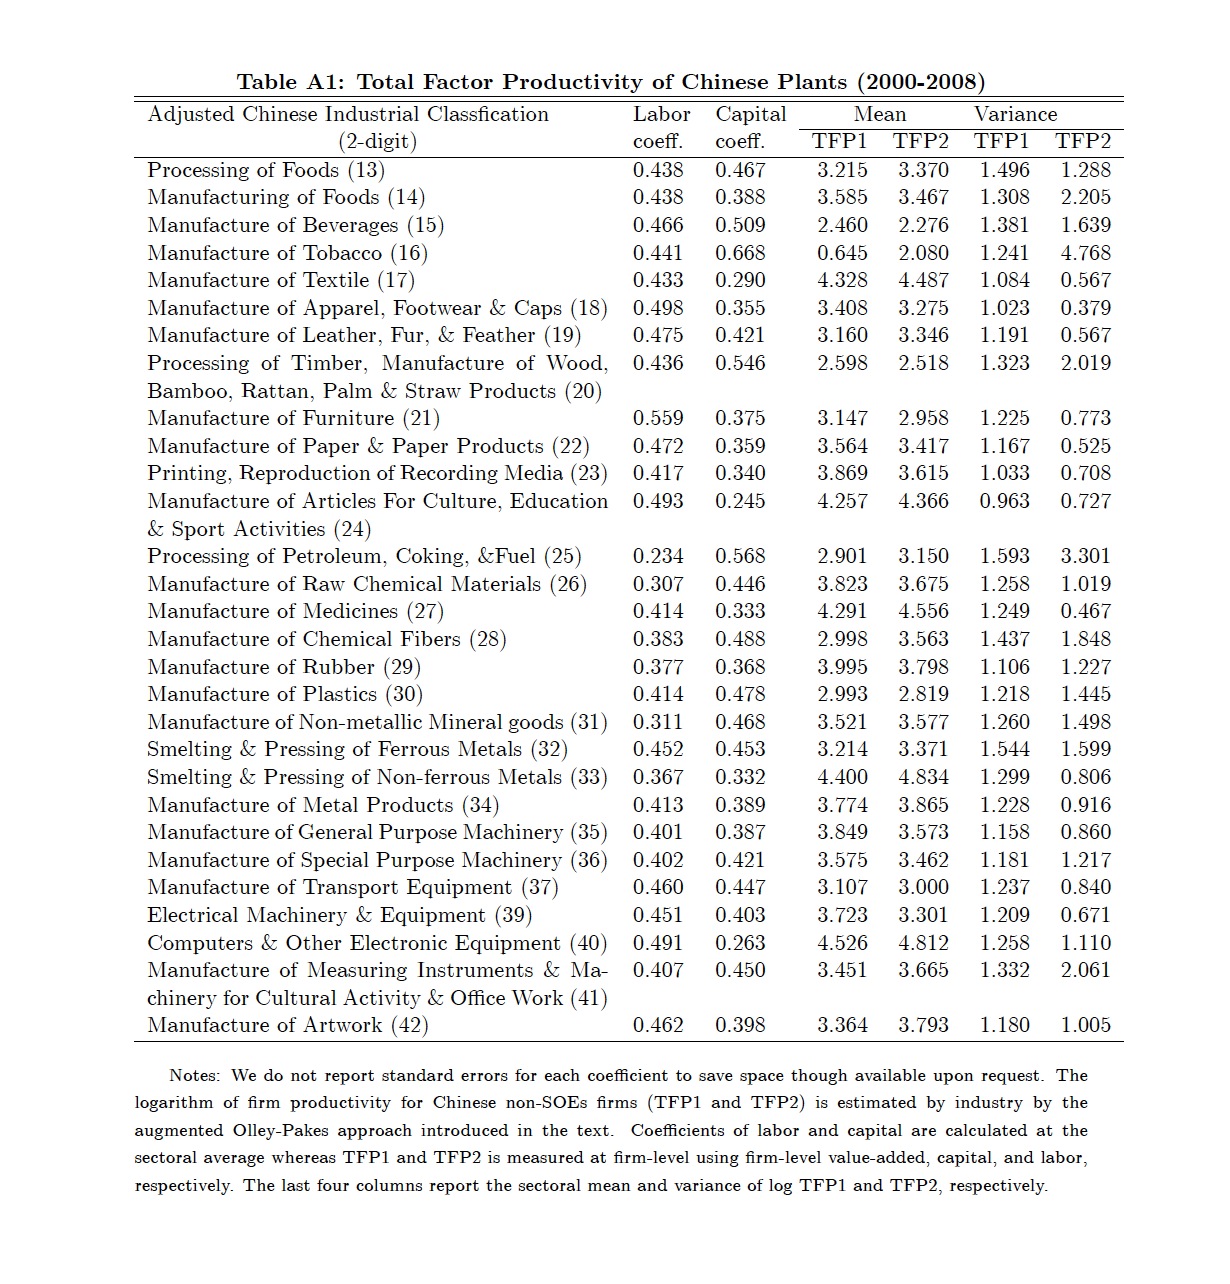
Table Al: Total Factor Productivity of Chinese Plants (2000-2008)
| Adjusted Chinese Industrial Classfication | Labor | Capital | Mean | Variance | ||
| (2-digit) | coeff. | coeff. | TFP1 TFP2 | TFP1 TFP2 | ||
| Processing of Foods (13) | 0.438 | 0.467 | 3.215 | 3.370 | 1.496 | 1.288 |
| Manufacturing of Foods (14) | 0.438 | 0.388 | 3.585 | 3.467 | 1.308 | 2.205 |
| Manufacture of Beverages (15) | 0.466 | 0.509 | 2.460 | 2.276 | 1.381 | 1.639 |
| Manufacture of Tobacco (16) | 0.441 | 0.668 | 0.645 | 2.080 | 1.241 | 4.768 |
| Manufacture of Textile (17) | 0.433 | 0.290 | 4.328 | 4.487 | 1.084 | 0.567 |
| Manufacture of Apparel, Footwear & Caps (18) | 0.498 | 0.355 | 3.408 | 3.275 | 1.023 | 0.379 |
| Manufacture of Leather, Fur, & Feather (19) | 0.475 | 0.421 | 3.160 | 3.346 | 1.191 | 0.567 |
| Processing of Timber, Manufacture of Wood, | 0.436 | 0.546 | 2.598 | 2.518 | 1.323 | 2.019 |
| Bamboo, Rattan, Palm & Straw Products (20) |
|
|
|
|
|
|
| Manufacture of Furniture (21) | 0.559 | 0.375 | 3.147 | 2.958 | 1.225 | 0.773 |
| Manufacture of Paper & Paper Products (22) | 0.472 | 0.359 | 3.564 | 3.417 | 1.167 | 0.525 |
| Printing, Reproduction of Recording Media (23) | 0.417 | 0.340 | 3.869 | 3.615 | 1.033 | 0.708 |
| Manufacture of Articles For Culture, Education | 0.493 | 0.245 | 4.257 | 4.366 | 0.963 | 0.727 |
| & Sport Activities (24) |
|
|
|
|
|
|
| Processing of Petroleum, Coking, &Fuel (25) | 0.234 | 0.568 | 2.901 | 3.150 | 1.593 | 3.301 |
| Manufacture of Raw Chemical Materials (26) | 0.307 | 0.446 | 3.823 | 3.675 | 1.258 | 1.019 |
| Manufacture of Medicines (27) | 0.414 | 0.333 | 4.291 | 4.556 | 1.249 | 0.467 |
| Manufacture of Chemical Fibers (28) | 0.383 | 0.488 | 2.998 | 3.563 | 1.437 | 1.848 |
| Manufacture of Rubber (29) | 0.377 | 0.368 | 3.995 | 3.798 | 1.106 | 1.227 |
| Manufacture of Plastics (30) | 0.414 | 0.478 | 2.993 | 2.819 | 1.218 | 1.445 |
| Manufacture of Non-metallic Mineral goods (31) | 0.311 | 0.468 | 3.521 | 3.577 | 1.260 | 1.498 |
| Smelting & Pressing of Ferrous Metals (32) | 0.452 | 0.453 | 3.214 | 3.371 | 1.544 | 1.599 |
| Smelting & Pressing of Non-ferrous Metals (33) | 0.367 | 0.332 | 4.400 | 4.834 | 1.299 | 0.806 |
| Manufacture of Metal Products (34) | 0.413 | 0.389 | 3.774 | 3.865 | 1.228 | 0.916 |
| Manufacture of General Purpose Machinery (35) | 0.401 | 0.387 | 3.849 | 3.573 | 1.158 | 0.860 |
| Manufacture of Special Purpose Machinery (36) | 0.402 | 0.421 | 3.575 | 3.462 | 1.181 | 1.217 |
| Manufacture of Transport Equipment (37) | 0.460 | 0.447 | 3.107 | 3.000 | 1.237 | 0.840 |
| Electrical Machinery & Equipment (39) | 0.451 | 0.403 | 3.723 | 3.301 | 1.209 | 0.671 |
| Computers & Other Electronic Equipment (40) | 0.491 | 0.263 | 4.526 | 4.812 | 1.258 | 1.110 |
| Manufacture of Measuring Instruments & Ma- | 0.407 | 0.450 | 3.451 | 3.665 | 1.332 | 2.061 |
| chinery for Cultural Activity & Offce Work (41) |
|
|
|
|
|
|
| Manufacture of Artwork (42) | 0.462 | 0.398 | 3.364 | 3.793 | 1.180 | 1.005 |
Notes We do not report standard errors for each coeffcient to save space though available upon request. The logarithm of firm productivity for Chinese non-SOEs firms (TFP1 and TFP2) is estimated by industry by the augmented Olley-Pakes approach introduced in the text. Coeffcients of labor and capital are calculated at the sectoral average whereas TFP1 and TFP2 is measured at firm-levelusing firm-levelvalue-added, capital,and labor,respectively. The last four columns report the sectoral mean and variance of log TFP1 and TFP2, respectively.
13


 4351
4351

 被折叠的 条评论
为什么被折叠?
被折叠的 条评论
为什么被折叠?
 到【灌水乐园】发言


