


 本文介绍了如何利用GraphPad Prism无需编程直出单细胞亚群的堆叠柱状图。步骤包括准备亚群数据、导入到Prism、进行数据分析、设置图例和比例、修改图表样式,最终得到专业的柱状图。
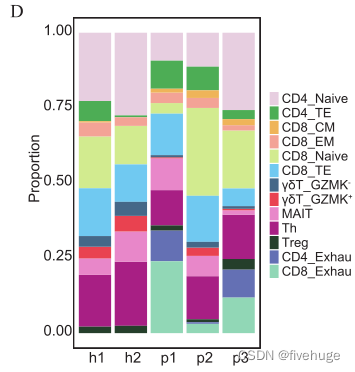
单细胞亚群分析后,虽然可以用R语言(如ggplot2包)出单细胞亚群的堆叠柱状图,今天想介绍一种零代码的Prism出图方式。
1.准备好亚群数据。
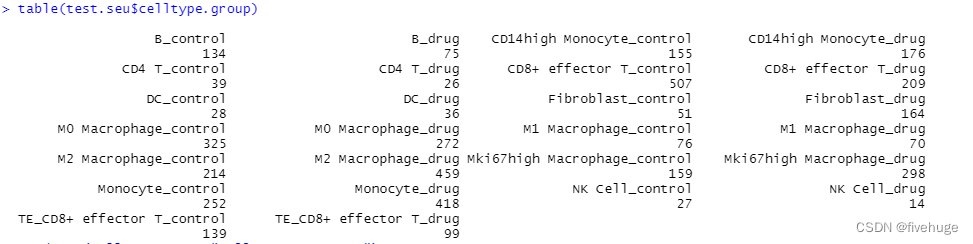
R中,通过 table(test.seu$celltype.group)得到细胞亚群的相关信息。
2.随后将数据整合入prism内。(建立Group的数据内容)

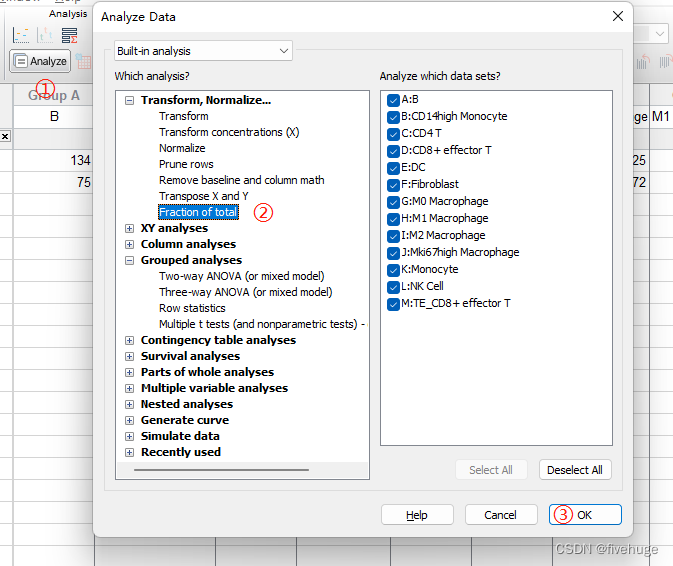
3.Analyze-Fraction of total-OK
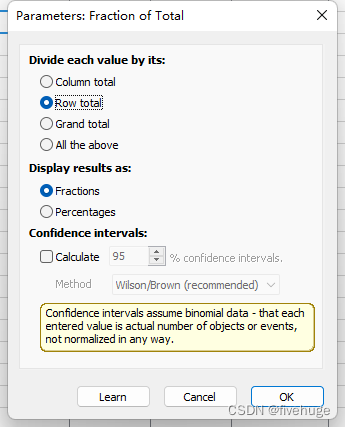
4.选择Row total;按需要选择Fractions或Percentages。
5
单细胞亚群分析后,虽然可以用R语言(如ggplot2包)出单细胞亚群的堆叠柱状图,今天想介绍一种零代码的Prism出图方式。
1.准备好亚群数据。
R中,通过 table(test.seu$celltype.group)得到细胞亚群的相关信息。
2.随后将数据整合入prism内。(建立Group的数据内容)
3.Analyze-Fraction of total-OK
4.选择Row total;按需要选择Fractions或Percentages。
5

 被折叠的 条评论
为什么被折叠?
被折叠的 条评论
为什么被折叠?
 到【灌水乐园】发言


 最低0.47元/天 解锁文章


 2360
2360


