


Jmeter插件使用
首先我们安装完插件配置后,要在插件中心安装这两个插件
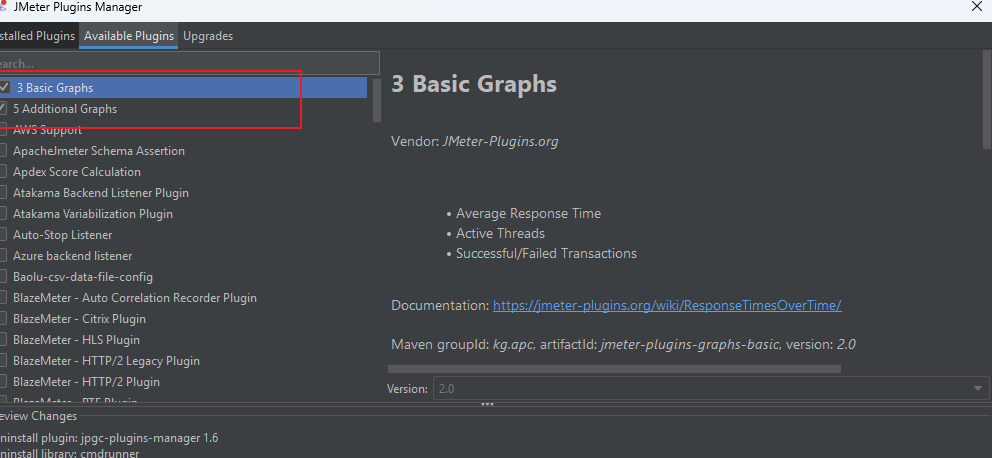
下载成功后出现以下结果:
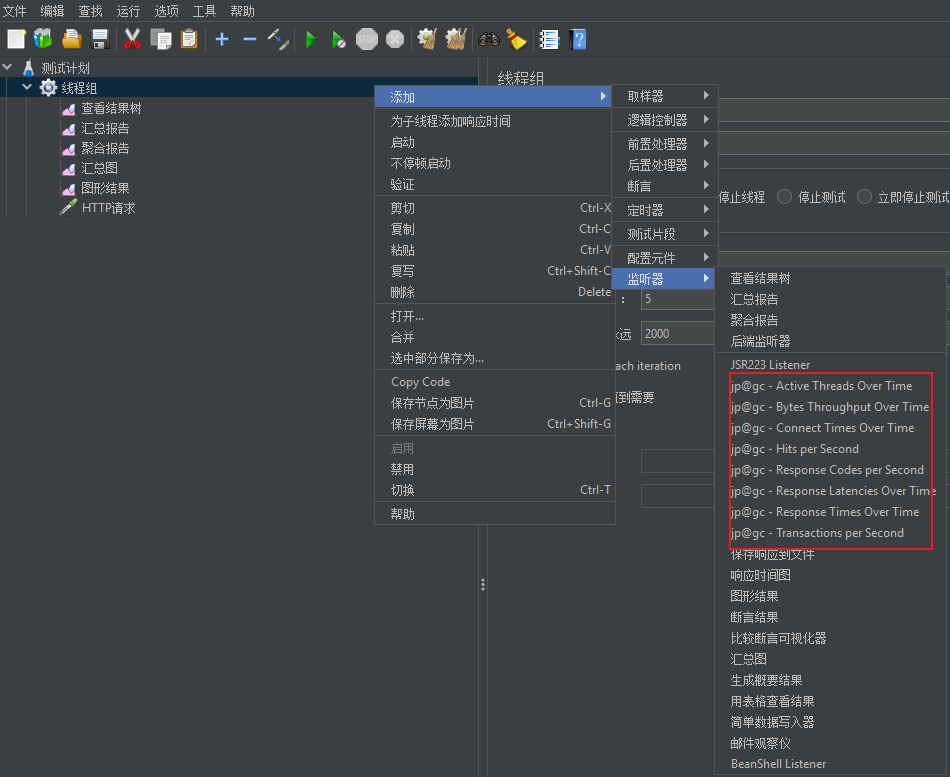
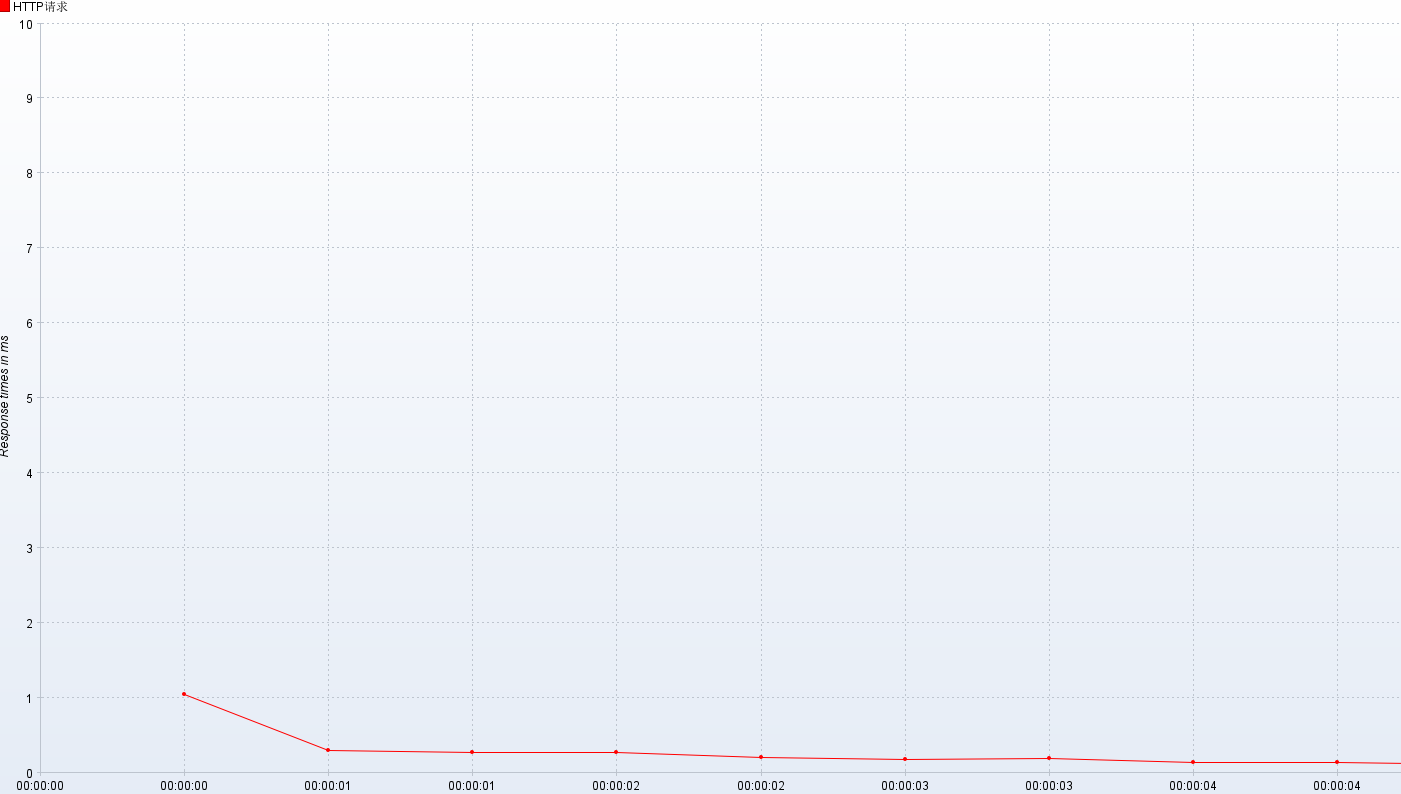
响应时间
- 响应时间:jp@gc - Response Times Over Time
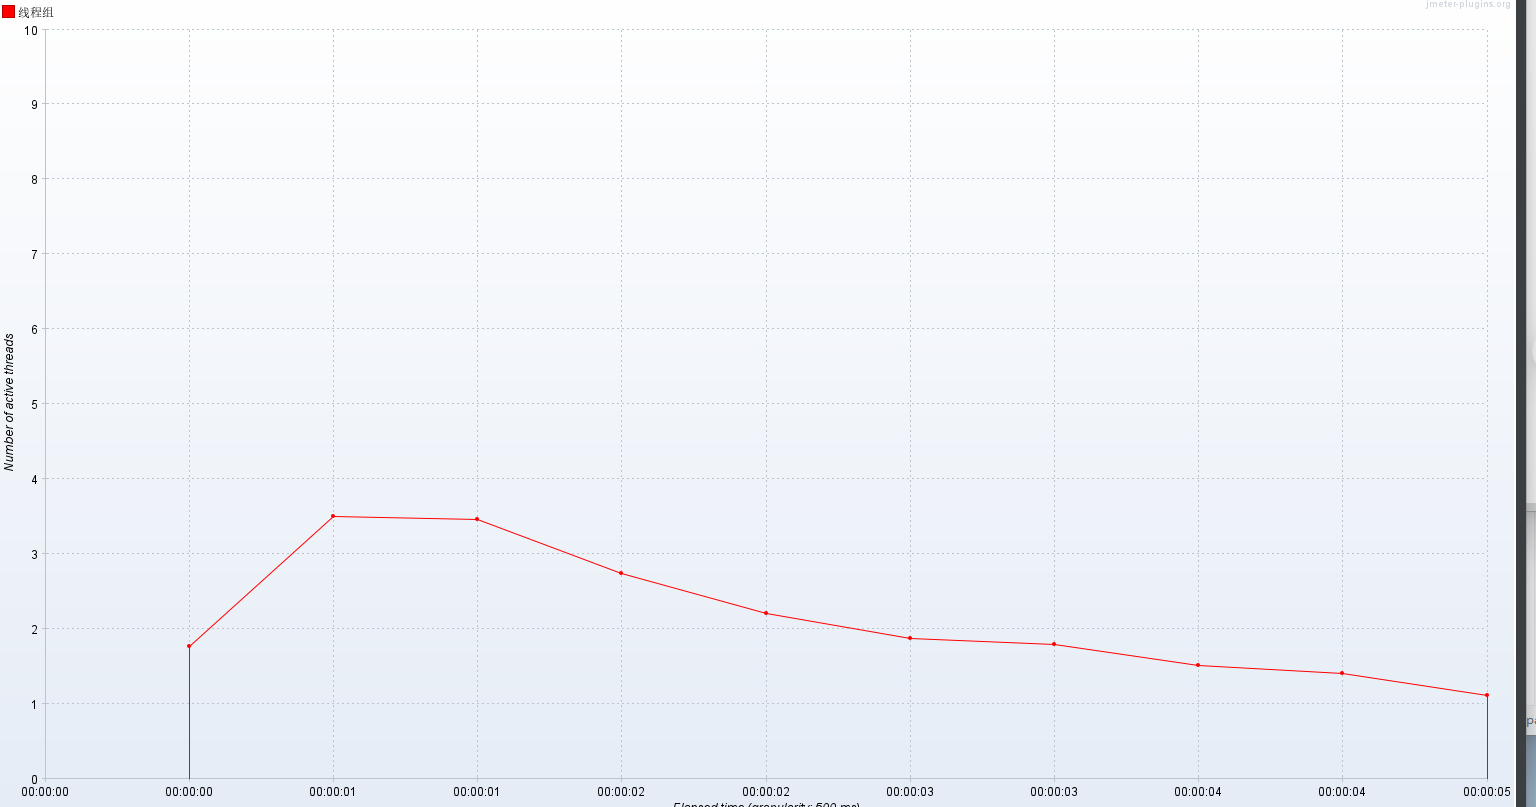
活动线程数
- 活动线程数:jp@gc - Active Threads Over Time
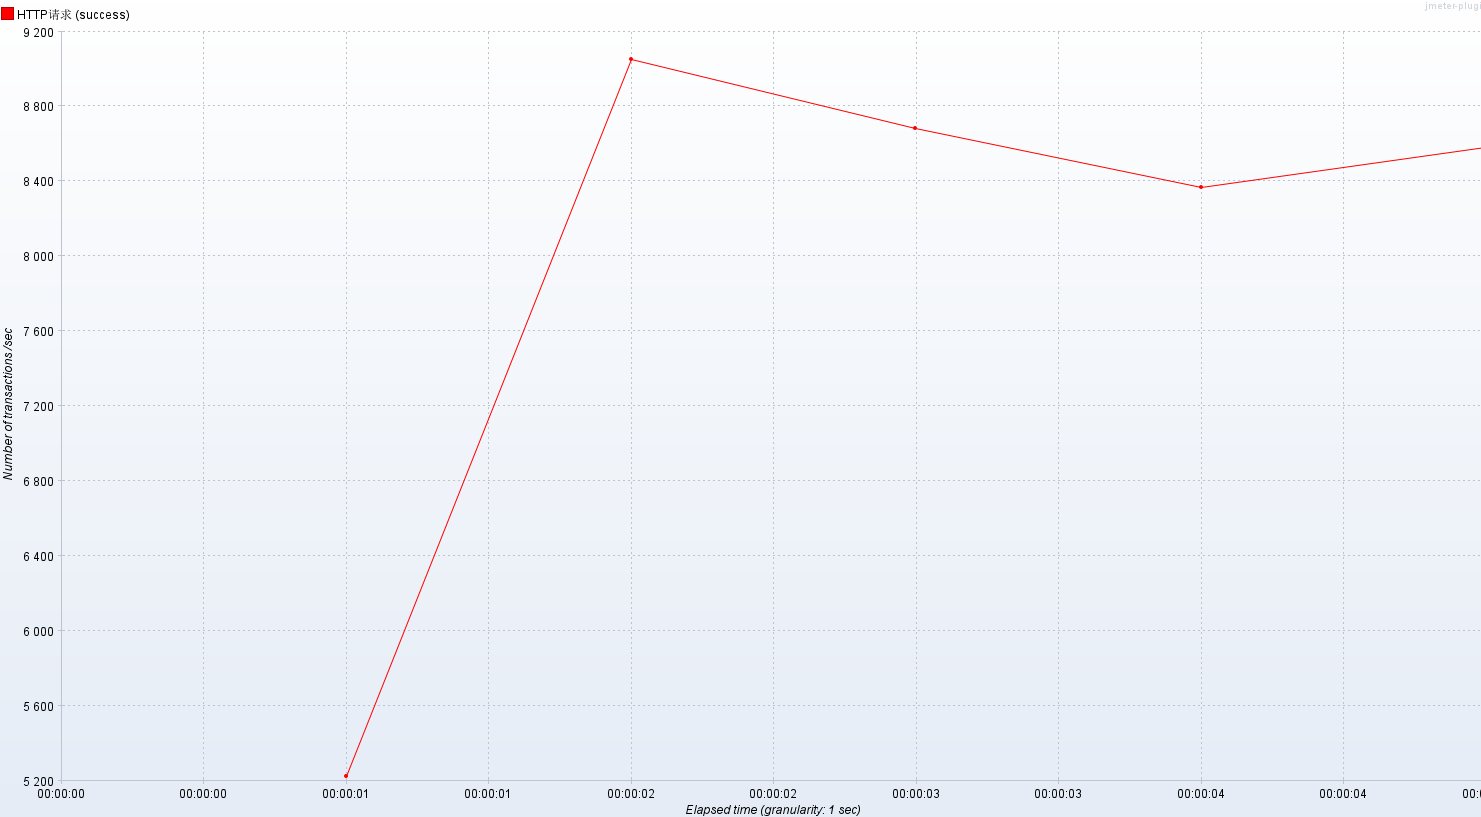
每秒事务数
- 每秒事务数:jp@gc - Transactions per Second
- RT(响应时间)
-
- 平均值:332ms
- P50(中位数):8ms 内
- P90:514ms 内
- P95:1051ms 内
- P99:6797ms 内
- 最小值:2ms
- 最大值:35s
- 压力机活动线程数
-
- 代表压测过程中施加的压力情况
- TPS(每秒事务数)
-
- 数值越大,性能越好
- QPS(每秒查询数量)
-
- 数值越大,性能越好
- (TPS >= QPS)
- 吞吐量(每秒请求数量)
-
- 数值越大,性能越好
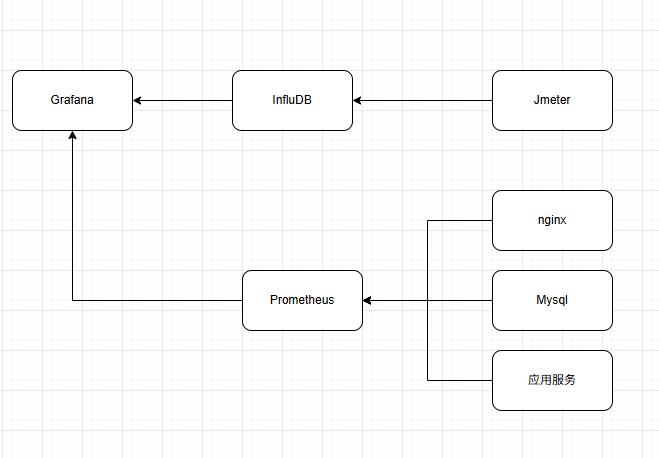
压测监控平台
压测平台架构图:
Docker环境配置
首先我们需要配置docker环境
# 1.更新yum包
sudo yum update -y

# 2.安装软件包
sudo yum install -y yum-utils device-mapper-persistent-data lvm2

# 3.设置yum源为阿里云
sudo yum-config-manager --add-repo http://mirrors.aliyun.com/docker-ce/linux/centos/docker-ce.repo

# 4.安装docker
sudo yum install docker-ce

# 5.检查docker版本
docker -v
安装InfluxDB
# 1.下载镜像
docker pull influxdb:1.8

# 2.启动容器
docker run -d --name influxdb -p 8086:8086 -p 8083:8083 influxdb:1.8

# 3.进入容器创建jmeter数据库
docker exec -it influxdb /bin/bash
操作influxDB
# 进入操作界面
influx

# 创建数据库
create database jmeter

# 查看数据库是否创建成功
show databases
创建完的结果为
Connected to http://localhost:8086 version 1.8.10
InfluxDB shell version: 1.8.10
> create database jmeter
> show databases
name: databases
name
----
_internal
jmeter
>
使用influxDB
# 使用jmeter库
use jmeter
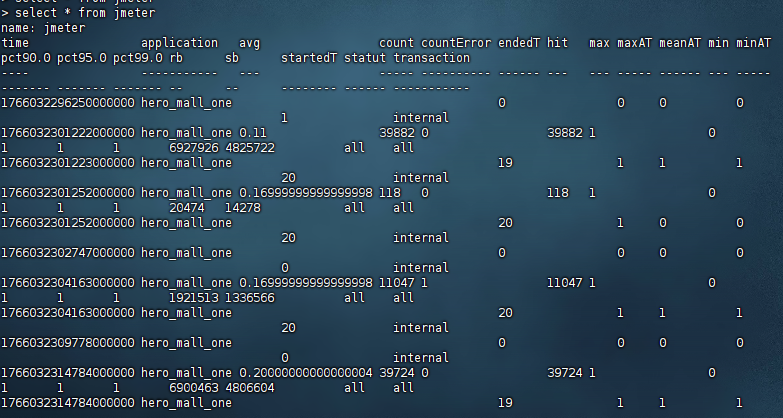
# 查询数据库中的数据
select * from jmeter设置Jmeter脚本后置监听器
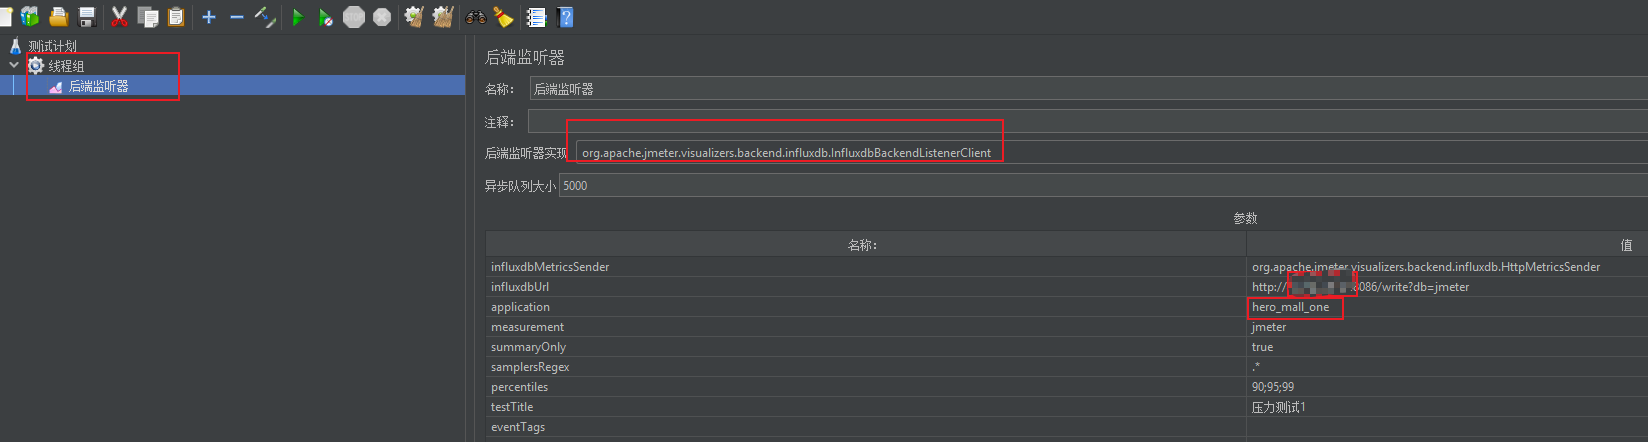
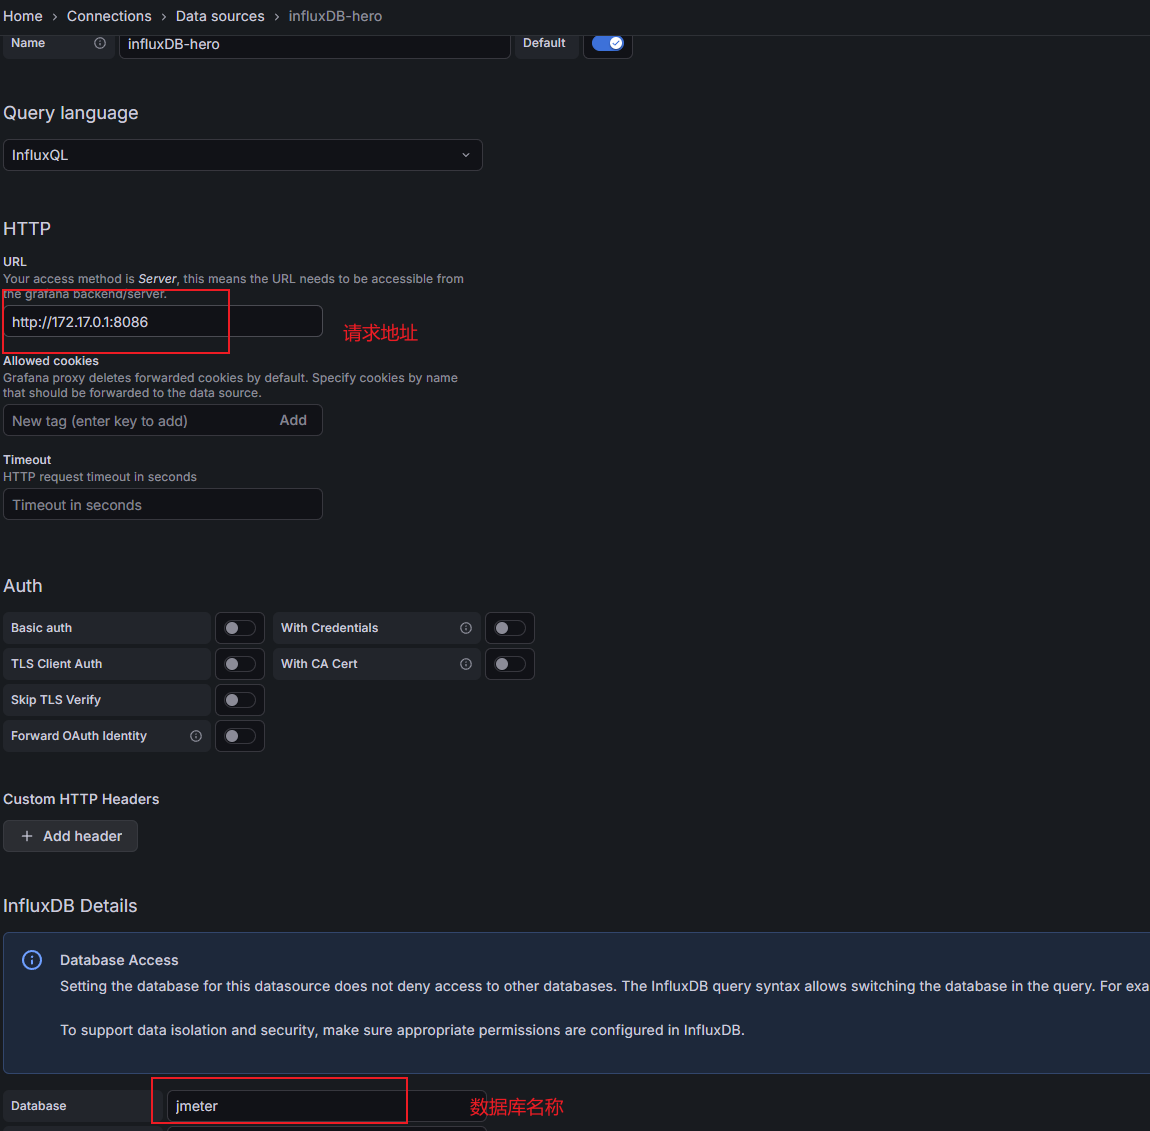
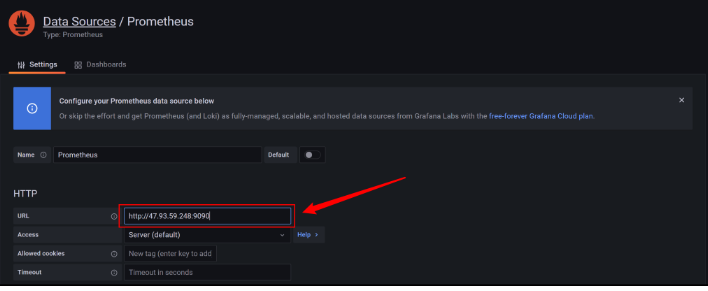
- influxdbUrl:需要改为自己influxdb的部署ip和映射端口,我这里是部署在阿里云服务器,所以就是47.93.59.248,口是容器启动时映射的8086端口,db后面跟的是刚才创建的数据库名称
- application:可根据需要自由定义,只是注意后面在 grafana 中选对即可
- measurement:表名,默认是 jmeter ,也可以自定义
- summaryOnly:选择true的话就只有总体的数据。false会记录总体数据,然后再将每个transaction都分别记录
- samplersRegex:样本正则表达式,将匹配的样本发送到数据库
- percentiles:响应时间的百分位P90、P95、P99
- testTitle:events表中的text字段的内容
- eventTags:任务标签,配合Grafana一起使用
然后我们启动压测工具,再查看数据库表,发现出现以下结构
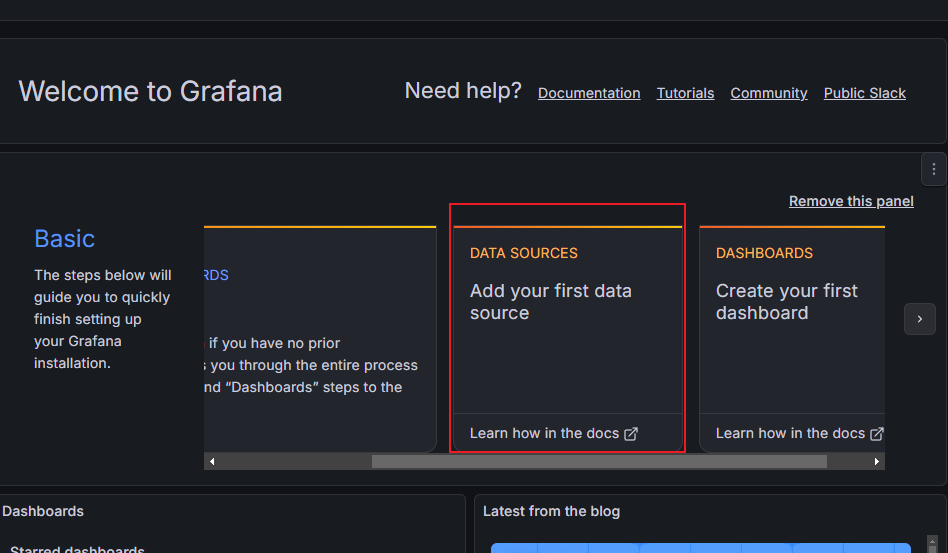
安装Grafana
# 1.下载Grafana镜像
docker pull grafana/grafana

# 2.启动Grafana容器
docker run -d --name grafana -p 3000:3000 grafana/grafana访问连接:http://guslegend:3000/login,默认用户名/密码:admin/admin

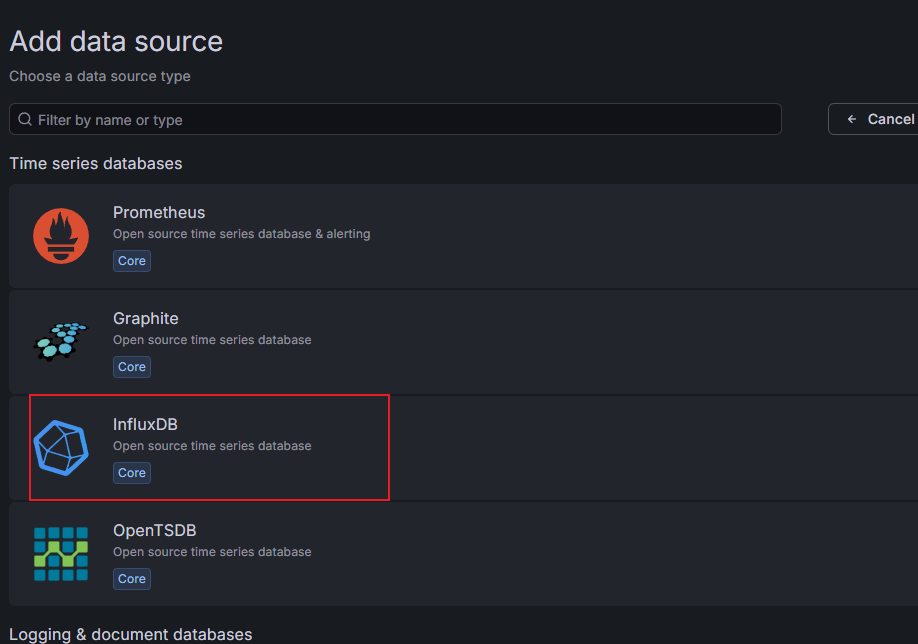
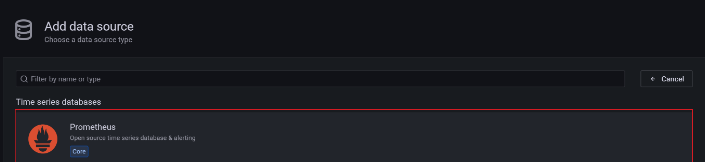
选择添加数据源
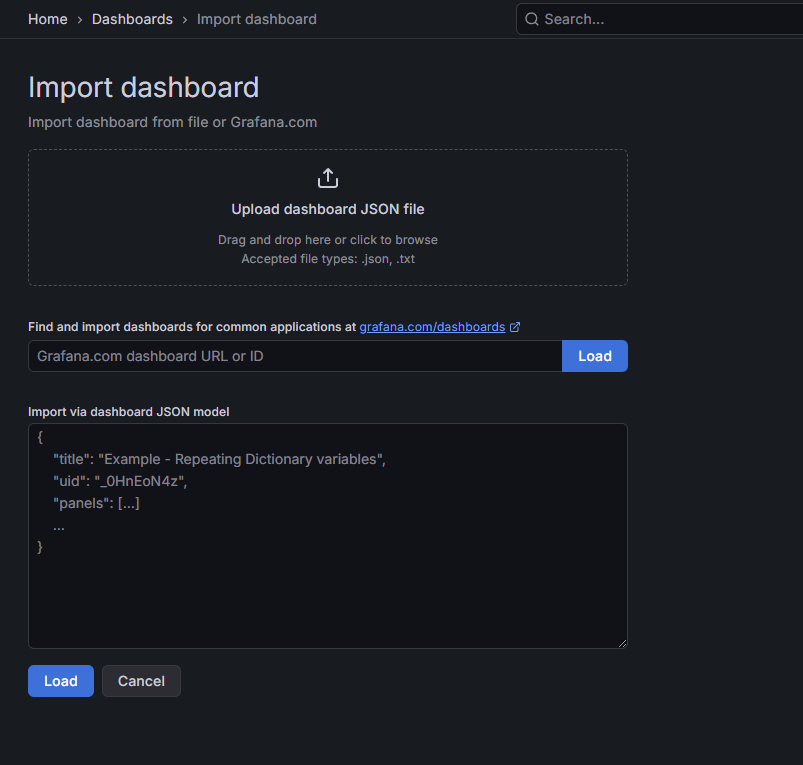
导入模版
- 直接输入模版id号;
- 上传模版json文件;
- 输入模版json内容;
在Grafana的官网找到我们需要的展示模板
- Apache JMeter Dashboard
-
- dashboad-ID:5496
- JMeter Dashboard(3.2 and up)
-
- dashboad-ID:3351
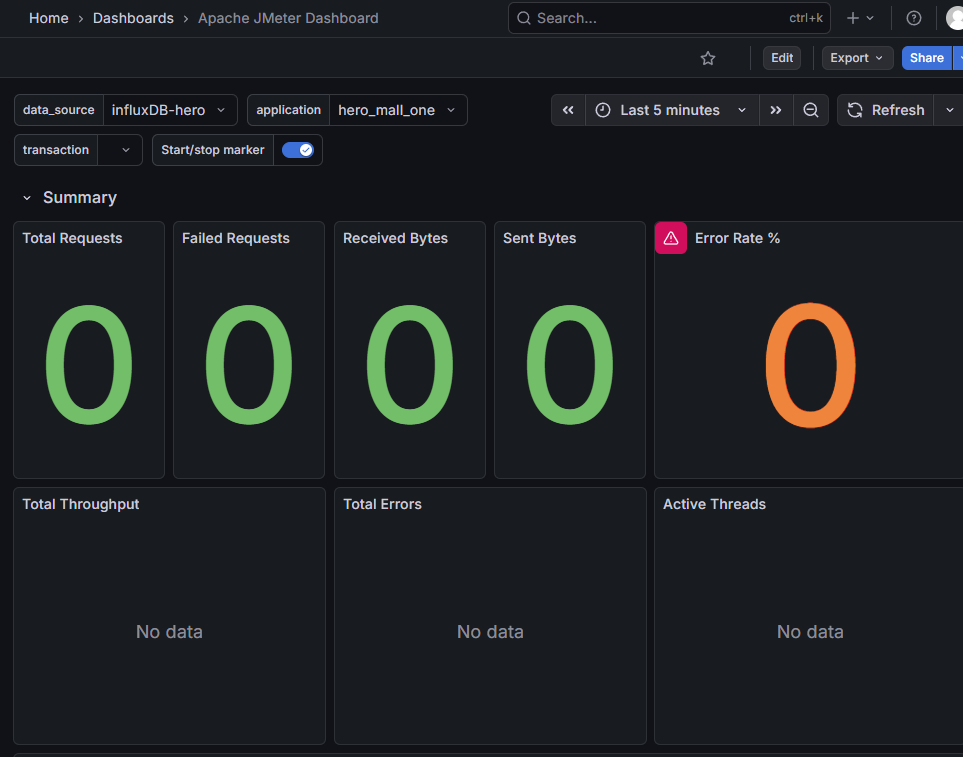
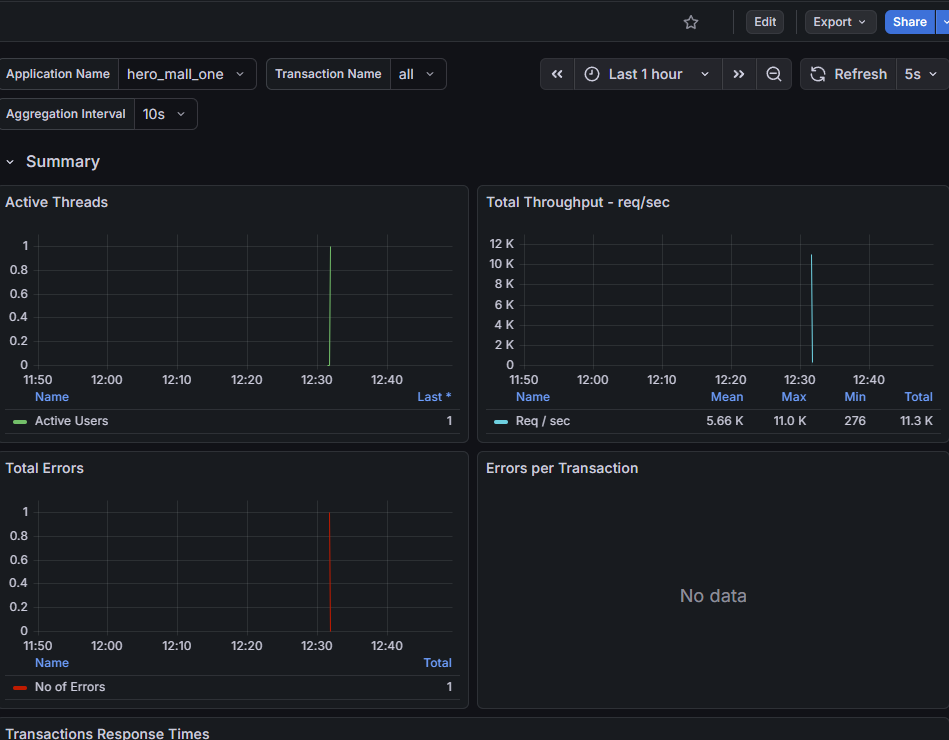
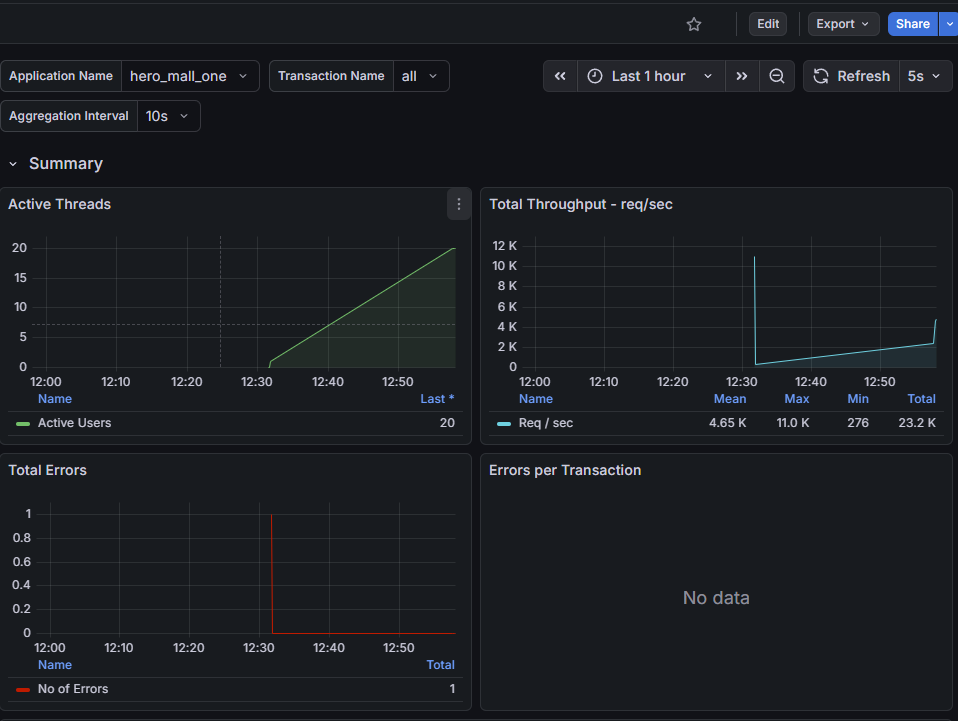
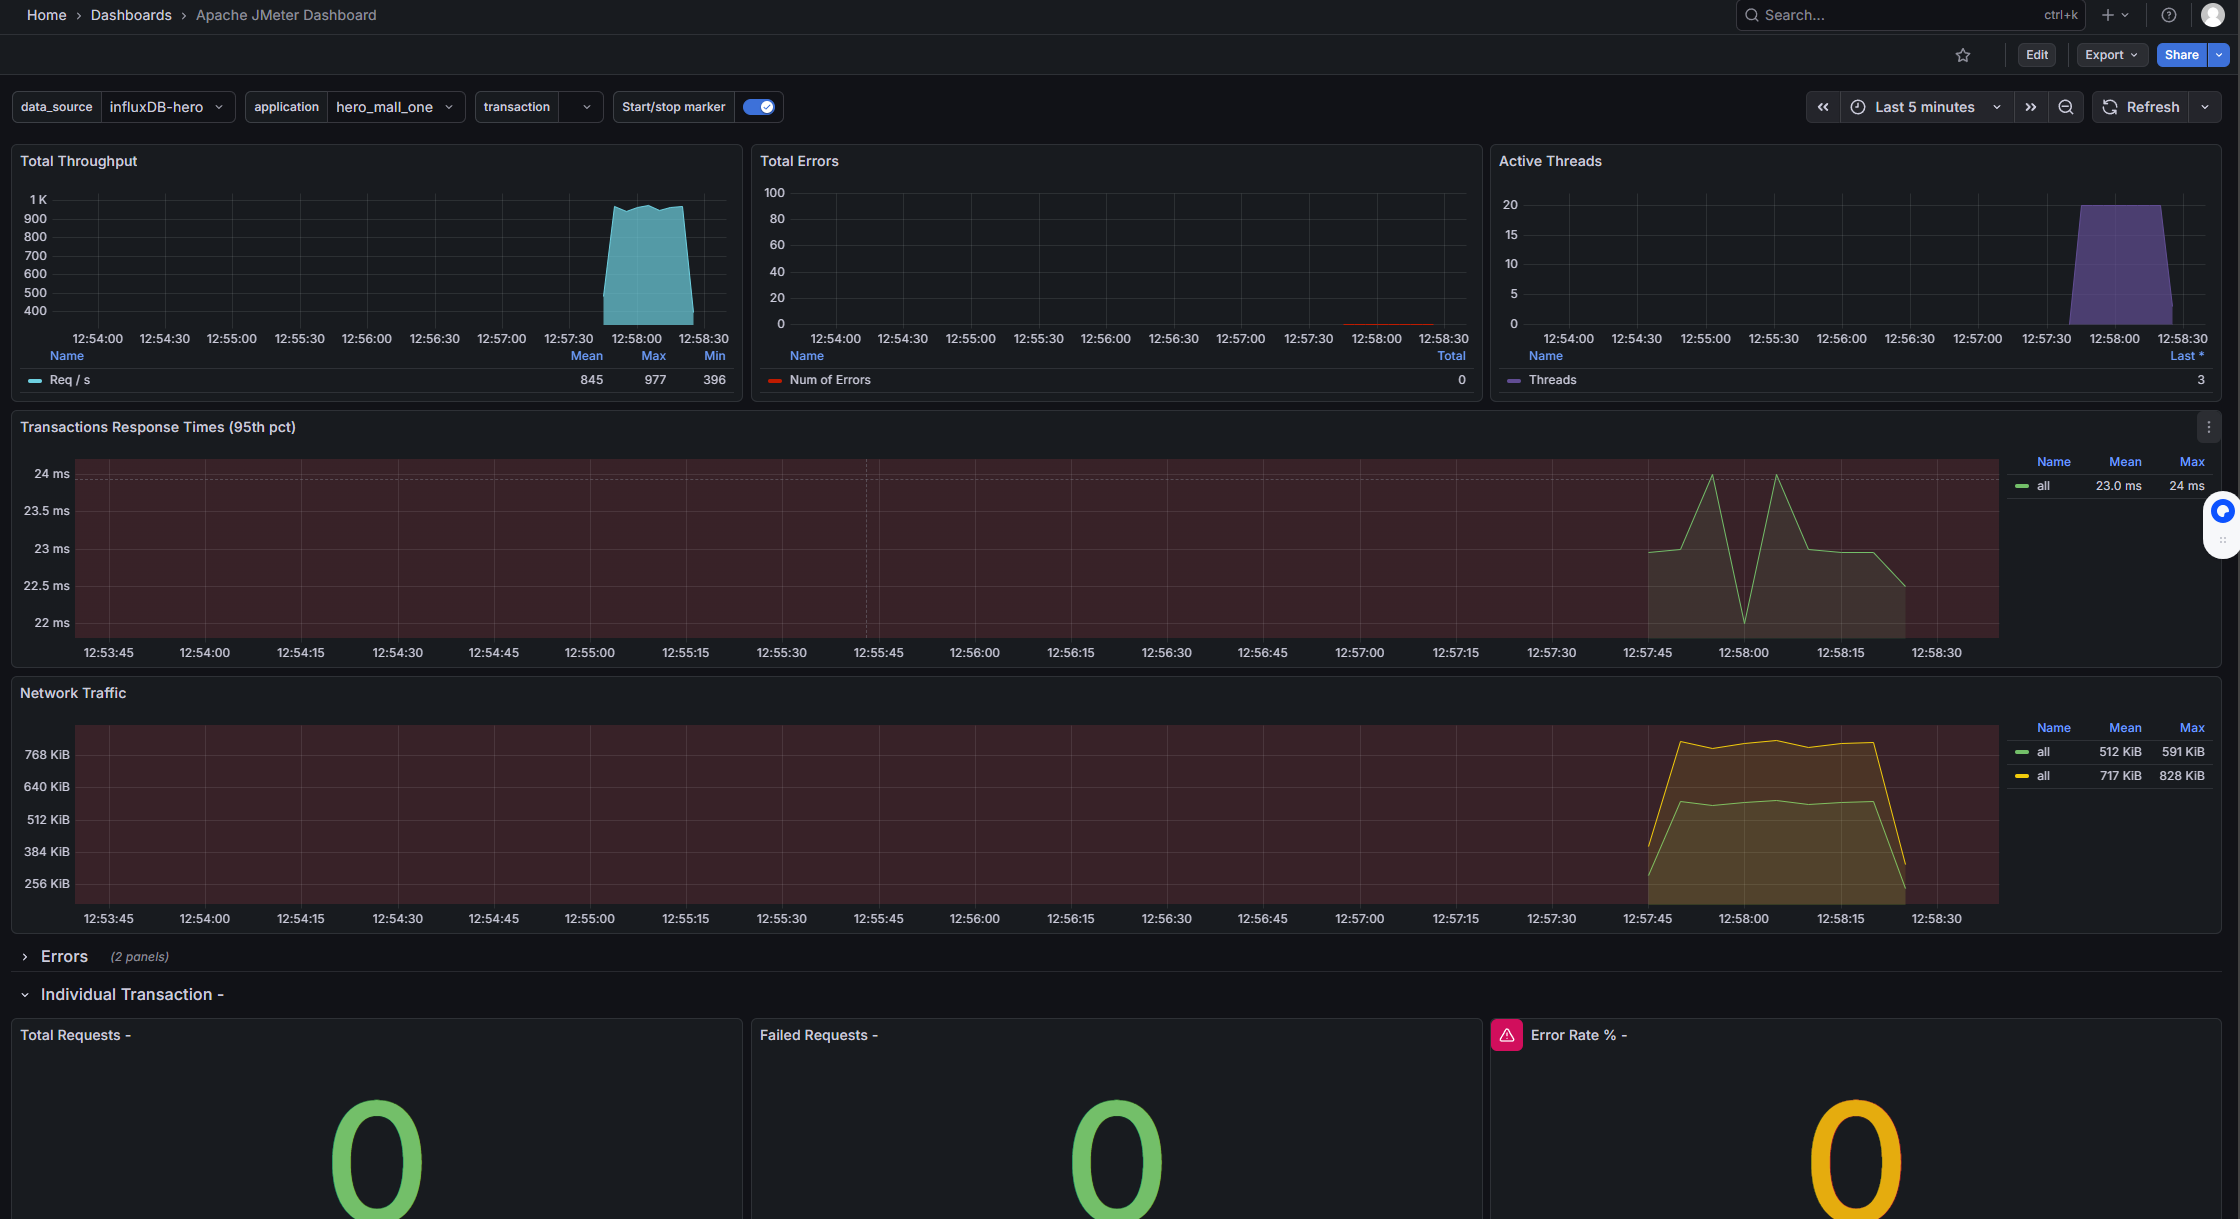
启动压测工具,查看结果
安装node_exporter
# 下载
wget -c https://github.com/prometheus/node_exporter/releases/download/v0.18.1/node_exporter-0.18.1.linux-amd64.tar.gz
# 解压
tar zxvf node_exporter-0.18.1.linux-amd64.tar.gz -C /usr/local/hero/
# 启动
cd /usr/local/hero/node_exporter-0.18.1.linux-amd64
nohup ./node_exporter > node.log 2>&1 &
安装Prometheus
# 下载
wget -c https://github.com/prometheus/prometheus/releases/download/v2.15.1/prometheus-2.15.1.linux-amd64.tar.gz
# 解压
mkdir /usr/local/hero/
tar zxvf prometheus-2.15.2.linux-amd64.tar.gz -C /usr/local/hero/
cd prometheus-2.15.2.linux-amd64

# 运行
nohup ./prometheus > prometheus.log 2>&1 &
配置prometheus.yml文件
# my global config
global:
  scrape_interval:     15s # Set the scrape interval to every 15 seconds. Default is every 1 minute.
  evaluation_interval: 15s # Evaluate rules every 15 seconds. The default is every 1 minute.
  # scrape_timeout is set to the global default (10s).

# Alertmanager configuration
alerting:
  alertmanagers:
  - static_configs:
    - targets:
      # - alertmanager:9093

# Load rules once and periodically evaluate them according to the global 'evaluation_interval'.
rule_files:
  # - "first_rules.yml"
  # - "second_rules.yml"

# A scrape configuration containing exactly one endpoint to scrape:
# Here it's Prometheus itself.
scrape_configs:
  # The job name is added as a label `job=<job_name>` to any timeseries scraped from this config.
  - job_name: 'hero-Linux'
    static_configs:
    - targets: ['172.17.0.1:9100','172.17.0.1:9100','172.17.0.1:9100']
访问:http://guslegend:9090/graph
在Grafana中配置Prometheus的数据源
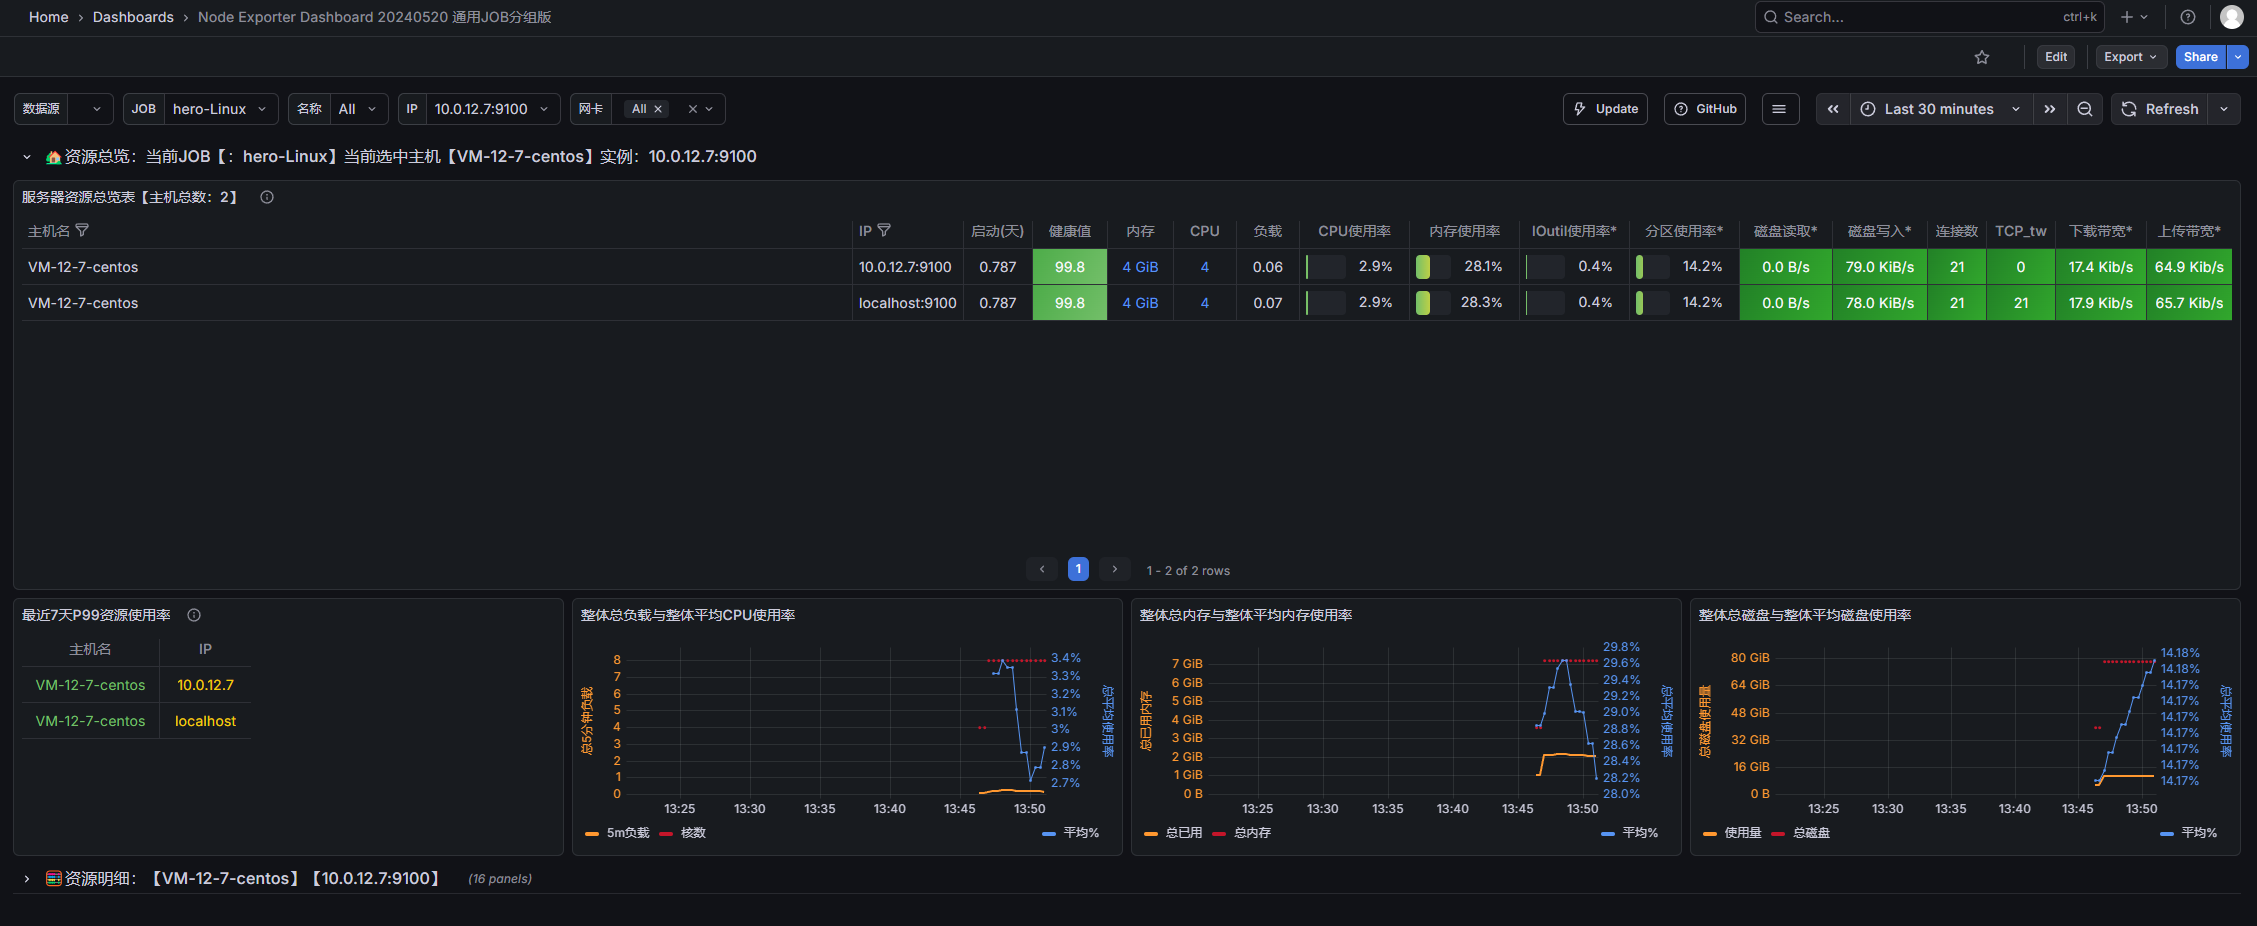
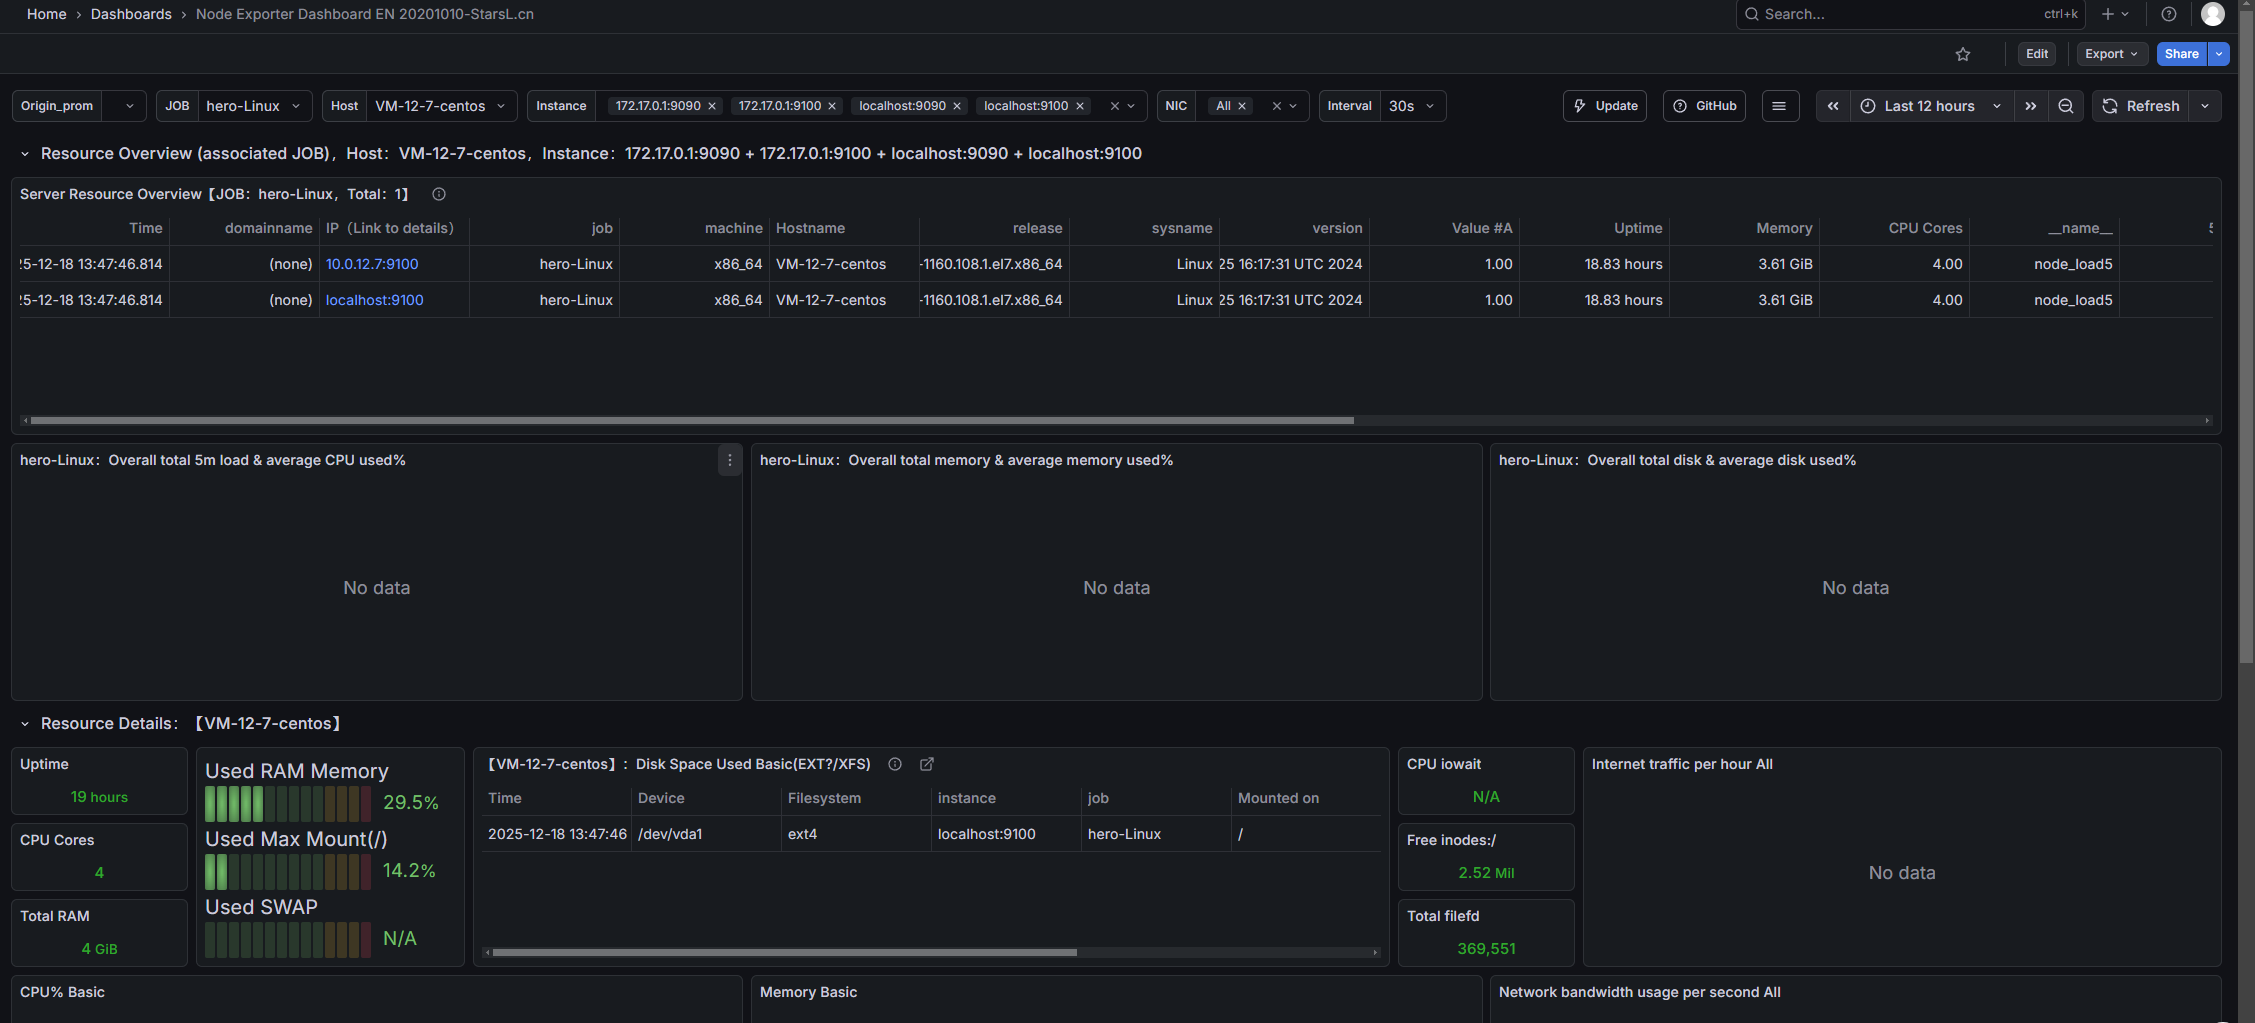
导入Linux系统dashboard
- Node Exporter for Prometheus Dashboard EN 20201010
-
- dashboard-ID: 11074
- Node Exporter Dashboard
-
- dashboard-ID: 16098


 1305
1305

 被折叠的 条评论
为什么被折叠?
被折叠的 条评论
为什么被折叠?
 到【灌水乐园】发言


