


最近做了一个项目,根据设备的状态,来判断设备是否有故障,这里总结一下所用到的数据探索,特征工程以及机器学习模型等方法。考虑到项目数据的敏感性,这里我以网上找到的一个公开数据集UCI Machine Learning Repository作为示例,其中用到的方法和我项目中所用到的方法是一致的。
数据探索
首先我们先对数据集探索一下,看一下包括了哪些特征以及特征的分布情况。这里都是采用Pandas和matplotlib来对数据进行探索
先看一下训练集的数据情况
train_df = pd.read_csv('train.csv')
train_df.info()
输出如下:
Data columns (total 14 columns):
 #   Column                   Non-Null Count   Dtype
---  ------                   --------------   -----
 0   id                       136429 non-null  int64
 1   Product ID               136429 non-null  object
 2   Type                     136429 non-null  object
 3   Air temperature [K]      136429 non-null  float64
 4   Process temperature [K]  136429 non-null  float64
 5   Rotational speed [rpm]   136429 non-null  int64
 6   Torque [Nm]              136429 non-null  float64
 7   Tool wear [min]          136429 non-null  int64
 8   Machine failure          136429 non-null  int64
 9   TWF                      136429 non-null  int64
 10  HDF                      136429 non-null  int64
 11  PWF                      136429 non-null  int64
 12  OSF                      136429 non-null  int64
 13  RNF                      136429 non-null  int64
可见训练集共有136429条数据,数据字段没有缺失值,其中Machine failure表示设备是否有故障。
我们可以查看一下头5条数据
train_df.head(5)输出如下:
从特征值可以看到,id和Product ID可以排除,Air Temperature, Process temperature, Rotational speed, Torque, Tool wear这几个特征是连续值,其他特征是分类值。
连续值特征分析
先对连续值的特征进行一些探索,看看数据的分布情况和Machine Failure之间的联系。
首先我们需要把训练集按照是否有Failure来进行分组,如以下代码:
grouped = train_df.groupby(train_df['Machine failure'])
group0 = grouped.get_group(0)
group1 = grouped.get_group(1)
然后我们对Air Temperature这个特征进行分析并以图形展示,如以下代码:
fig = plt.figure(figsize=(16, 12))
plot_rows = 3
plot_cols = 2
ax1 = plt.subplot2grid((plot_rows,plot_cols), (0,0), rowspan=1, colspan=1)
plt.hist(
    [group0['Air temperature [K]'], group1['Air temperature [K]']],
    bins=10,
    stacked = False,
    label=['No Failure', 'Failure'], alpha = .6)
plt.legend(loc='best', fontsize='x-small')
ax1.set_title('Failure distribution by air temperature')
ax1.set_yscale('log')
#----
ax2 = plt.subplot2grid((plot_rows,plot_cols), (0,1), rowspan=1, colspan=1)
plt.boxplot(
    [group0['Air temperature [K]'], group1['Air temperature [K]']],
    labels=['No Failure', 'Failure'])
plt.legend(loc='best', fontsize='x-small')
ax2.set_title('Failure box plot by air temperature')
#----
ax3 = plt.subplot2grid((plot_rows,plot_cols), (1,0), rowspan=1, colspan=1)
plt.hist(
    [group1['Air temperature [K]']],
    bins=10,
    stacked = False,
    density= True,
    label=['Failure'], alpha = .6)
ax3.set_title('Density hist plot by air temperature for failures')
#----
ax4 = plt.subplot2grid((plot_rows,plot_cols), (1,1), rowspan=1, colspan=1)
plt.hist(
    [train_df['Air temperature [K]']],
    bins=20,
    stacked = False,
    density= False,
    alpha = .6)
ax4.set_title('Distribution or air temperature')
结果如下:
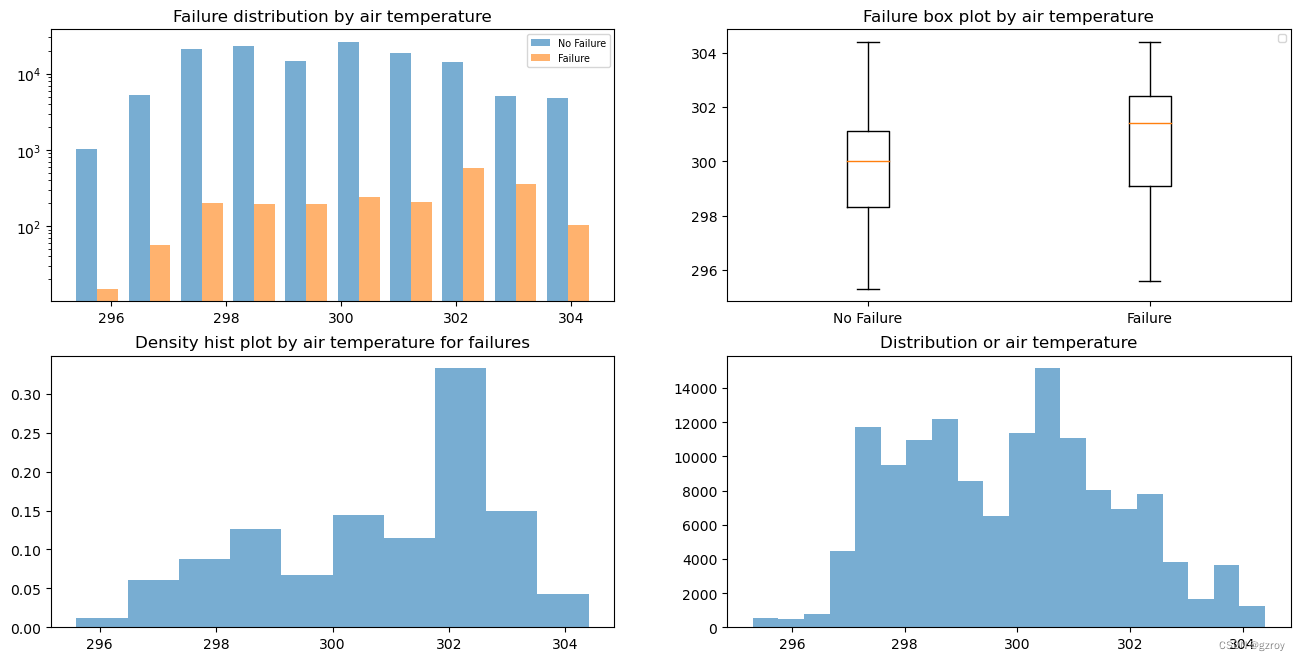
从图中可以看到当温度在302左右时故障较多,对应有故障和无故障的温度分布规律有差异,整体的温度分布大致符合正态分布。
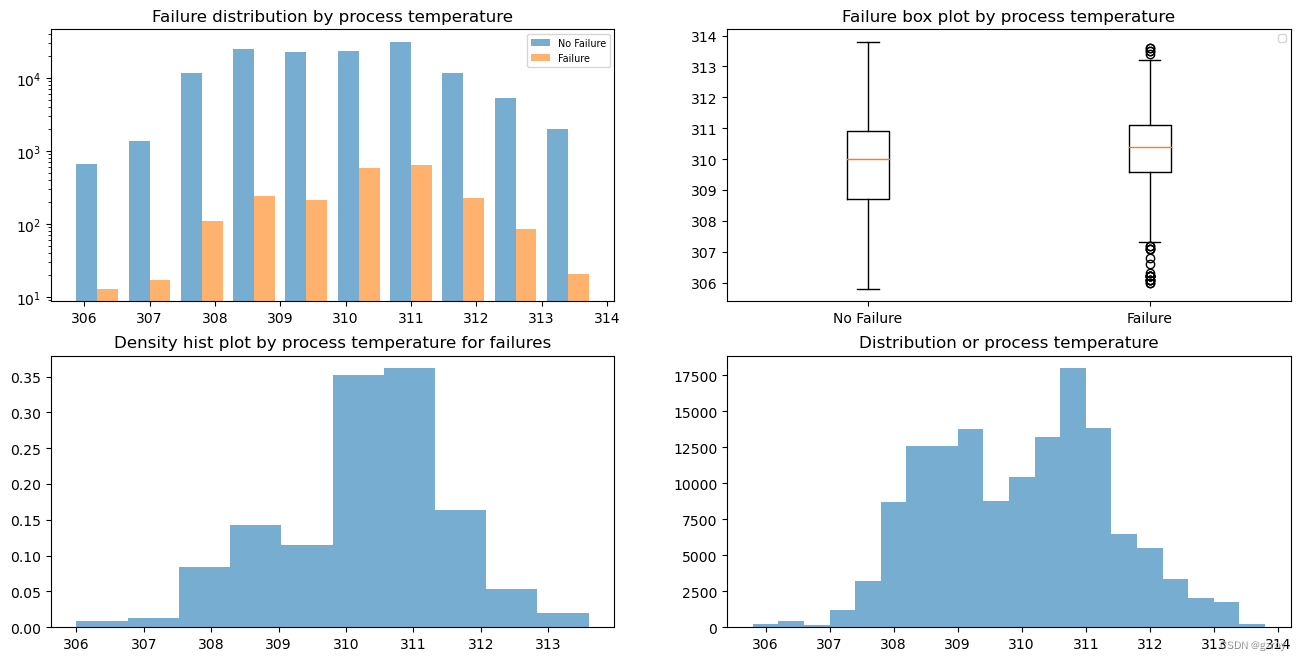
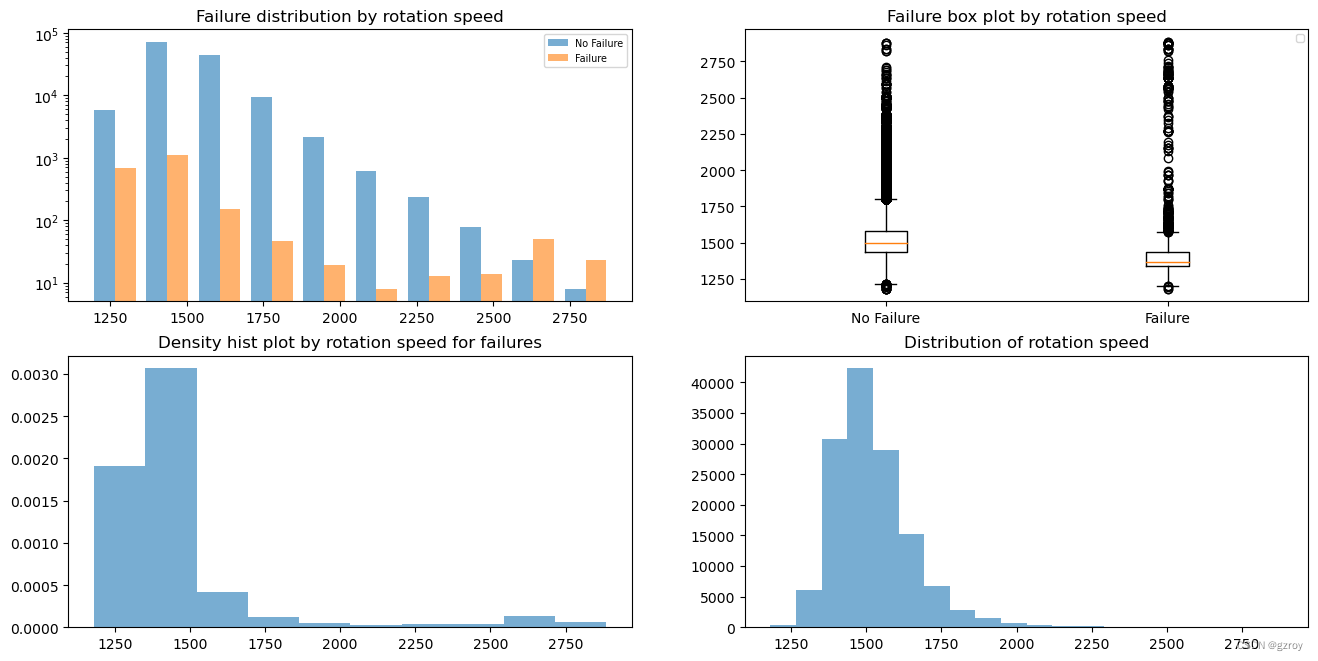
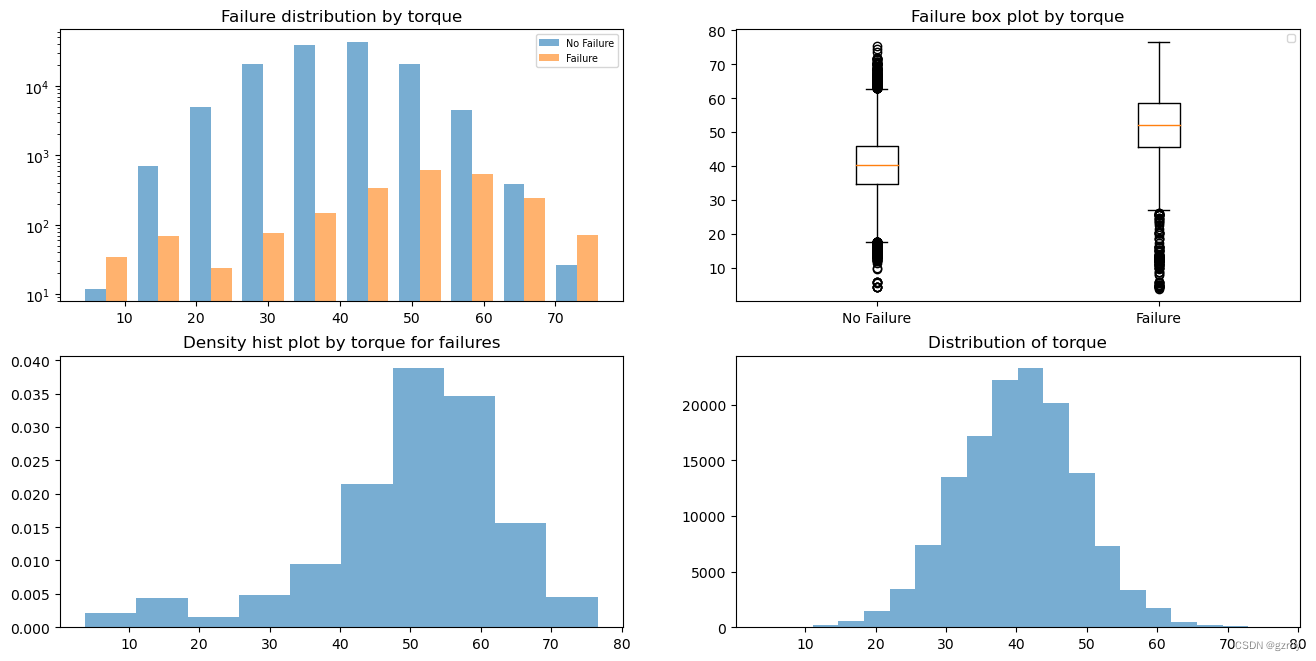
用类似的代码可以看到另外几个连续值特征的分析。
Process Temperature
Rotational speed
Torque
Tool wear
 最低0.47元/天 解锁文章


 4143
4143

 被折叠的 条评论
为什么被折叠?
被折叠的 条评论
为什么被折叠?
 到【灌水乐园】发言


