


 本文介绍了如何在Stata中使用esttab和estout命令将统计模型转换为LaTeX格式。esttab适用于简单输出当前模型,支持自定义显著性符号和 LaTeX 表格样式。estout则更复杂,可输出历史存储模型,通过stats()选项显示标量统计信息。cells()选项用于指定参数统计信息及其排列方式,如b、se、t、p和ci。eststo用于存储模型,estpost处理非e-class命令结果。实操部分讲解了如何在LaTeX和Stata中导出tex文件,以及使用midrule等高级功能。
esttab
原理:
生成模型,esttab 可以立即输出当下模型
基本用法:
eststo: qui reg x y
esttab [ namelist ] [ using filename ] [ , options estout_options ]
eststo clear
具体用法:
labels titles and notes
. esttab, label                               ///
>     title(This is a regression table)       ///
>     nonumbers mtitles("Model A" "Model B")  ///
>     addnote("Source: auto.dta")
自定义显著性符号
. esttab, star(+ 0.10 * 0.05)
转出latex:
在latex中代码
\documentclass{article}
\begin{document}
\input{example.tex}
\end{document}
在stata中导出tex
注意使用latex包 booktabs dcolumn
esttab using example.tex, label replace booktabs ///
  alignment(D{.}{.}{-1}) width(0.8\hsize)        ///
  title(Regression table\label{tab1})

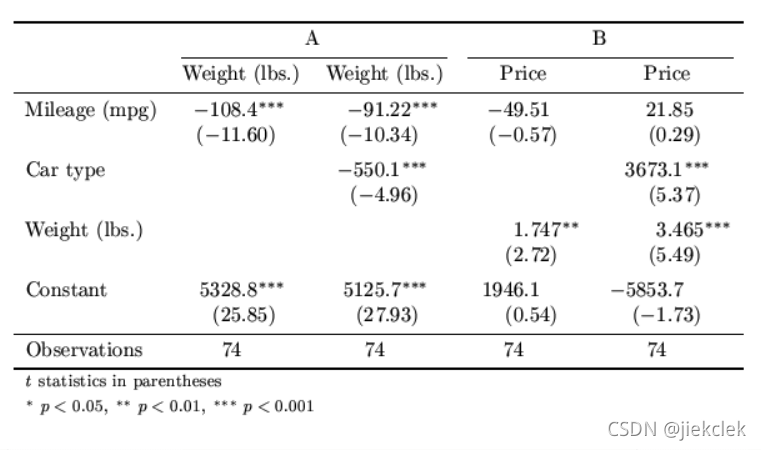
esttab using example.tex, booktabs label            ///
>     mgroups(A B, pattern(1 0 1 0)                   ///
>         prefix(\multicolumn{@span}{c}{) suffix(})   ///
>         span erepeat(\cmidrule(lr){@span}))         ///
>     alignment(D{.}{.}{-1}) page(dcolumn) nonumber
cell的用法:自定义列
specifying cells() disables b(), beta(), main(), t(), abs, not, se(), p(), ci(), aux(), star, staraux, wide, onecell, parentheses, and brackets. In the following example the cells() option is used to print point estimates, t statistics, and variance inflation factors in one table:
esttab, cells("b(fmt(a3) star) vif(fmt(2))" t(par fmt(2)))
list 模型:
esttab, noisily notype
estout
生成模型,存储,estout可以输出当下和历史已被存储的模型
相对esttab更复杂
基本用法:
cell stats表示主要内容
这里也可以使用 eststo: qui reg x y : eststo存储模型的所有部分,而estimates可以选择性存储
reg x y
estimates store m1
reg x1 y1
estimates store m2
estout [ namelist (历史模型 *表示所有存储的模型) ] [ using filename ] [ , cells(array) stats(scalarlist)  style(style: 表示表格风格)  options ]
estmiates clear
style:
设置风格为tex
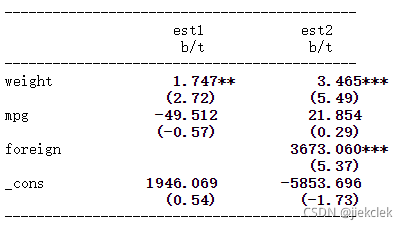
estout, style(tex) varlabels(_cons \_cons)

            &        est1&        est2\\
            &           b&           b\\
weight      &    1.746559&    3.464706\\
mpg         &   -49.51222&     21.8536\\
foreign     &            &     3673.06\\
\_cons      &    1946.069&   -5853.696\\
cells:
使用cell()选项指定要制表的参数统计信息以及它们的排列方式。
可用的参数统计量有b(点估计;默认值)、se(标准误差)、t (t-/z-统计量)、p(p 值)、ci(置信区间;显示下限和上限)单独的单元格使用ci_l和ci_u),以及包含在e()模型返回值中的任何其他参数统计信息。
默认情况下,多个统计信息被放置在单独的行中。但是,在引号中或括号中列出的元素并排放置。例如,指定 cells(“b set p”)或等效的 cells((b se tp))会生成下表:
这两种方法可以结合使用。例如,cells(" bp " se) 或cells((bp) se)会生成一个表格,其中每个模型的第一列中的原始系数和标准误差在彼此下方,而 p 值位于第二列的顶行中:
对于在cells()选项中命名的每个统计信息,可以在括号中指定一组子选项。例如,在社会科学中,通常在系数下方的括号中报告标准误差或 t 统计量,并用星号表示各个系数的显着性。此外,结果是四舍五入的。可以按如下方式创建这样的表:
所述estout默认为显示为p <0.05,** 为p <0.01,和**为p <0.001。但是,请注意,重要性阈值和符号是完全可定制的(请参阅estout的重要性星级选项)。
请说明区别:
cells(b p) bp是一列
cells(“b p se”) bpse 横向成列
cells(“b p” se) bp横向成列,se在b下方
cells(b(star fmt(3)) t(par fmt(2))) 参数内部指定 star加上显著性星号,par加上括号,fmt指定小数点位数
stats:
使用stats()选项指定要在表尾中为每个模型显示的标量统计信息。可用的标量统计有aic(Akaike 的信息准则)、bic(Schwarz 的信息准则)、rank(e(V)的秩,即模型中自由参数的数量)、p(模型的 p 值)、以及模型的e()返回值中包含的任何标量(请参阅estout的 摘要统计选项)。在估计模型后键入ereturn list以查看返回结果的列表。
e()表示 字符
estout, cells(b se(par)) stats(N vce)
labels:
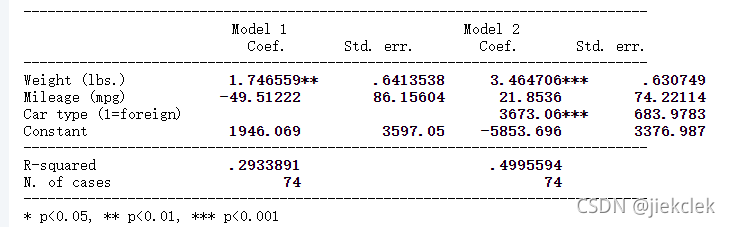
estout, cells("b(star label(Coef.)) se(label(Std. err.))")  ///
>     stats(r2 N, labels(R-squared "N. of cases"))            ///
>     label legend varlabels(_cons Constant)
fmt:
fmt() suboption in cells() and stats() can be used to determine the display formats of the tabulates statistics.
eststo
eststo用来存储刚刚估计的模型
eststo clear 用来清空之前存储的模型
. sysuse auto
(1978 Automobile Data)

. quietly regress price weight mpg

. eststo model1 (这里也可以不命名,那么之后的输出是全部存储的对象)

. quietly regress price weight mpg foreign

. eststo model2

. estimates table model1 model2

----------------------------------------
    Variable |   model1       model2
-------------+--------------------------
      weight |  1.7465592    3.4647058
         mpg | -49.512221    21.853604
     foreign |               3673.0604
       _cons |  1946.0687   -5853.6957
----------------------------------------

. eststo clear
另外一种写法:把eststo作为前置命令。此时可以运用by 或者 for 循环
. eststo: quietly regress price weight mpg
(est1 stored)

. eststo: quietly regress price weight mpg foreign
(est2 stored)

. esttab
e()存储标量:
eststo, addscalars(p_diff r(p)) (e(p_diff) = .55138216 added)
estpost
esttab和estout将命令的e()返回列表,但并非所有命令都在e() 中返回其结果。 estpost是一种工具,可以将一些最流行的非“e-class”命令的结果用于制表。它收集结果并将它们以适当的形式发布在e() 中
estpost summarize price weight rep78 mpg
esttab, cells("count mean sd min max") noobs


 1753
1753

 被折叠的 条评论
为什么被折叠?
被折叠的 条评论
为什么被折叠?
 到【灌水乐园】发言


