


学习笔记汇总
Pandas学习(一)–数据的导入
pandas学习(二)–双色球数据分析
pandas学习(三)–NAB球员薪资分析
pandas学习(四)–数据的归一化
pandas学习(五)–pandas学习视频
本章主要利用双色球开奖数据来学习pandas的DataFrame数据选取,Series的统计功能,以及matplotlib画柱状图。
ball.py
# -*- coding: utf-8 -*-
import pandas as pd
import numpy as np
import matplotlib.pyplot as plt
from utils import *

HISTORY_NUM = "079"  # 历史同期
HEAD_NUM = 30  # 近30期

plt.rcParams['font.sans-serif'] = ['SimHei']  # 用来正常显示中文标签
plt.rcParams['axes.unicode_minus'] = False  # 用来正常显示负号

# read data
data_sheet = 'ssqexcle_result.xls'
all_data = pd.read_excel(data_sheet, parse_cols=(0, 2, 3, 4, 5, 6, 7, 8))
all_data['index'] = all_data['index'].astype(np.str)

#统计历史数据
history_data = all_data[[x.endswith(HISTORY_NUM) for x in all_data['index']]].copy()
history_red_ball = history_data.iloc[:, 1:7]
history_blue_ball = history_data.iloc[:, 7]

count_red_ball = history_red_ball.stack().value_counts()
count_blue_ball = history_blue_ball.value_counts()

# 画图
plt.figure(1)
count_red_ball.plot(kind='bar', align='center')
plt.xlabel("红球数字")
plt.ylabel("次数")
plt.show()

plt.figure(2)
count_blue_ball.plot(kind='bar', align='center')
plt.xlabel("蓝球数字")
plt.ylabel("次数")
plt.show()

#统计近n期数据
head_n_data = all_data.head(HEAD_NUM).copy()
head_n_red_ball = head_n_data.iloc[:, 1:7]
head_n_blue_ball = head_n_data.iloc[:, 7]

odd_even_dict = calculate_odd_vs_even(head_n_red_ball) #计算奇偶比
print(odd_even_dict)

#计算3区比
result = cal_3distance_times(all_data.iloc[:, 1:7])
print(result)

# 统计红球2连号出现次数
result = cal_2sequence_num_times(all_data.iloc[:, 1:7])
print(result)

# 统计红球3连号出现次数
result = cal_3sequence_num_times(all_data.iloc[:, 1:7])
print(result)

#统计2个球组合出现的频次
result = cal_2combination_times(all_data.iloc[:, 1:7])
print(result)

#统计3个红球组合出现的频次
result = cal_3combination_times(all_data.iloc[:, 1:7])
print(result)
utils.py
# -*- coding: utf-8 -*-


def calculate_odd_vs_even(dataframe):
    # 计算奇偶比
    result_dict = {}
    for index, row in dataframe.iterrows():
        odd = 0  # 奇数
        even = 0  # 偶数
        for x in row:
            if x & 1:
                odd += 1
            else:
                even += 1
        key = "%s:%s" % (str(odd), str(even))
        if key in result_dict:
            result_dict[key] += 1
        else:
            result_dict[key] = 1
    return result_dict


def cal_2sequence_num_times(dataframe):
    """
    计算红球2连号出现的频次
    """
    result_dict = {}
    for index, row in dataframe.iterrows():
        a = 1
        while a < 33:
            if (a in row.values) and (a + 1 in row.values):
                key = "%s:%s" % (str(a), str(a + 1))
                if key in result_dict:
                    result_dict[key] += 1
                else:
                    result_dict[key] = 1
            a += 1
    return sorted(result_dict.items(), key=lambda item: item[1])


def cal_3sequence_num_times(dataframe):
    """
    计算红球3连号出现的频次
    """
    result_dict = {}
    for index, row in dataframe.iterrows():
        a = 1
        while a < 32:
            if (a in row.values) and (a + 1 in row.values) and (a + 2 in row.values):
                key = "%s:%s:%s" % (str(a), str(a + 1), str(a + 2))
                if key in result_dict:
                    result_dict[key] += 1
                else:
                    result_dict[key] = 1
            a += 1
    return sorted(result_dict.items(), key=lambda item: item[1])


def cal_3distance_times(dataframe):
    """
    计算红球的3区比
    """
    result_dict = {}
    for index, row in dataframe.iterrows():
        little = 0  # 小区
        middle = 0  # 中区
        big = 0  # 大区
        for x in row.values:
            if x <= 11:
                little += 1
            elif x <= 22:
                middle += 1
            else:
                big += 1
        key = "%s:%s:%s" % (str(little), str(middle), str(big))
        if key in result_dict:
            result_dict[key] += 1
        else:
            result_dict[key] = 1
    return sorted(result_dict.items(), key=lambda item: item[1])


def cal_2combination_times(dataframe):
    """
    计算红球2个球组合出现的频次
    """
    result_dict = {}
    for index, row in dataframe.iterrows():
        for a in range(6):
            for b in range(a + 1, 6):
                key = "%s:%s" % (str(row.values[a]), str(row.values[b]))
                if key in result_dict:
                    result_dict[key] += 1
                else:
                    result_dict[key] = 1
    return sorted(result_dict.items(), key=lambda item: item[1])


def cal_3combination_times(dataframe):
    """
    计算红球3个球组合出现的频次
    """
    result_dict = {}
    for index, row in dataframe.iterrows():
        for a in range(6):
            for b in range(a + 1, 6):
                for c in range(b + 1, 6):
                    key = "%s:%s:%s" % (str(row.values[a]), str(row.values[b]), str(row.values[c]))
                    if key in result_dict:
                        result_dict[key] += 1
                    else:
                        result_dict[key] = 1

    return sorted(result_dict.items(), key=lambda item: item[1])
获取出来的历史数据如下所示:
        index  red1  red2  red3  red4  red5  red6 blue
20    2017079     3     7    14    23    25    27   08
173   2016079     1     3    10    12    24    28   02
327   2015079     9    14    15    20    26    32   11
479   2014079     2     7    16    22    27    28   02
633   2013079     7    13    17    19    22    26   13
787   2012079     6     7    12    24    30    33   12
940   2011079     3    14    15    16    24    29   05
1093  2010079     8    11    12    14    18    22   02
1247  2009079     2     9    16    21    30    31   13
1401  2008079     3     4     5    10    20    32   09
1554  2007079     3     4    14    20    21    25   14
1708  2006079     6    11    13    17    20    32   08
1861  2005079     3     9    20    24    25    28   05
1983  2004079     7    13    14    17    19    30   03
2072  2003079    12    15    22    23    26    31   04
画出来的 图如下所示:
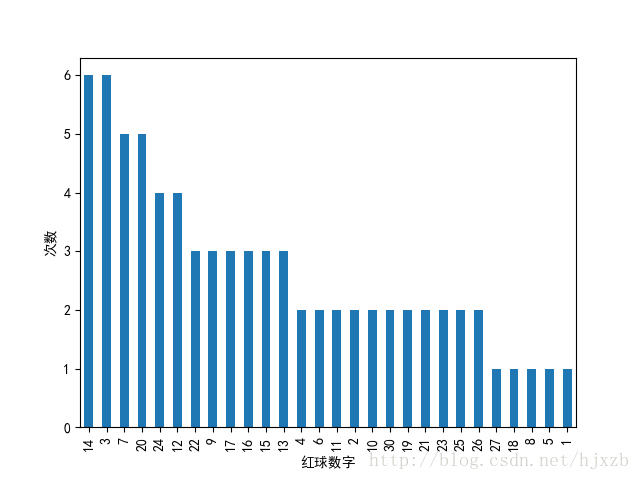
1、红球历史数据次数统计图
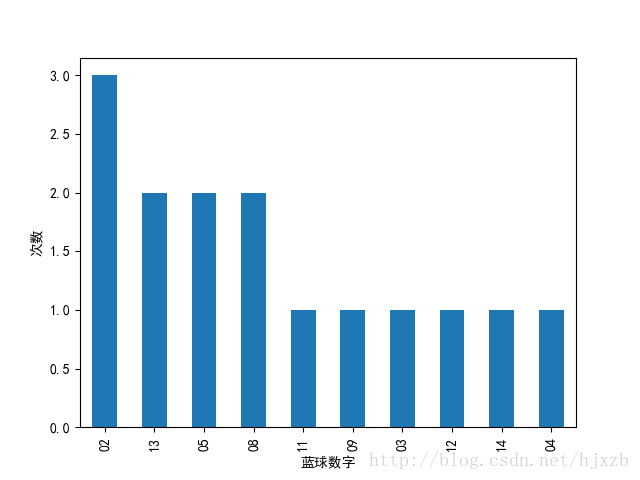
2、蓝球历史数据次数统计图
数据以及代码下载地址:链接:http://pan.baidu.com/s/1c1OdNs0 密码:87k6
欢迎python爱好者加入:学习交流群 667279387


 97
97

 被折叠的 条评论
为什么被折叠?
被折叠的 条评论
为什么被折叠?
 到【灌水乐园】发言


