


 本文介绍了在电动汽车充电站运营管理中,如何利用历史数据和相关特征构建电量预测模型,通过LightGBM算法进行训练,并进行数据预处理、特征工程和交叉验证,以提升充电站运营服务和电网管理效率。
赛题背景
在电动汽车充电站运营管理中,准确预测充电站的电量需求对于提高充电站运营服务水平和优化区域电网供给能力非常关键。本次赛题旨在建立站点充电量预测模型,根据充电站的相关信息和历史电量数据,准确预测未来某段时间内充电站的充电量需求。
在赛题数据中,我们提供了电动汽车充电站的场站编号、位置信息、历史电量等基本信息。我们鼓励参赛选手在已有数据的基础上补充或构造额外的特征,以获得更好的预测性能。
赛事任务
参赛者需要基于这些数据,利用人工智能相关技术,建立预测模型来预测未来一段时间内的需求电量,帮助管理者提高充电站的运营效益和服务水平,促进电动汽车行业的整体发展。
赛题数据集
- 本赛题提供的数据集包含三张数据表。
- 其中,
power_forecast_history.csv为站点运营数据,power.csv为站点充电量数据,stub_info.csv为站点静态数据,训练集为历史一年的数据,测试集为未来一周的数据。
数据集清单与格式说明
导入的库
# import 相关库
import numpy as np   # 导入NumPy库,用于进行数值计算和数组操作。
import pandas as pd  # 导入Pandas库,用于数据处理和分析。
import lightgbm as lgb  # 导入LightGBM库,用于梯度提升树模型的训练和预测。
from sklearn.model_selection import StratifiedKFold, KFold, GroupKFold  # 导入StratifiedKFold、KFold和GroupKFold等交叉验证方法,用于模型评估和选择。
from sklearn.metrics import mean_squared_error, mean_absolute_error  # 导入均方误差和平均绝对误差等评估指标,用于评估模型的性能。
import matplotlib.pyplot as plt  # 绘制图表和可视化数据。
import warnings             # 导入warnings模块,用于控制警告信息的显示。
warnings.filterwarnings('ignore')
数据准备
"""(1)数据准备"""
# 读取数据
# 读取train数据集
train_power_forecast_history = pd.read_csv('./data/训练集/power_forecast_history.csv')
train_power = pd.read_csv('./data/训练集/power.csv')
train_stub_info = pd.read_csv('./data/训练集/stub_info.csv')
# 读取test数据集
test_power_forecast_history = pd.read_csv('./data/测试集/power_forecast_history.csv')
test_stub_info = pd.read_csv('./data/测试集/stub_info.csv')

# 聚合数据
# 对test_power_forecast_history进行分组,按照id_encode和ds进行分组,并选择每组的第一行。
train_df = train_power_forecast_history.groupby(['id_encode','ds']).head(1)
# 从train_df中删除名为hour的列。
del train_df['hour']

# 对test_power_forecast_history进行分组,按照id_encode和ds进行分组,并选择每组的第一行。
test_df = test_power_forecast_history.groupby(['id_encode','ds']).head(1)
# 从test_df中删除名为hour的列。
del test_df['hour']

# 对train_power进行分组,按照id_encode和ds进行分组,并计算每组中power列的总和。
tmp_df = train_power.groupby(['id_encode','ds'])['power'].sum()
# 列名修改
tmp_df.columns = ['id_encode','ds','power']
a = tmp_df
# 合并充电量数据
# 将train_df和tmp_df按照id_encode和ds进行左连接
train_df = train_df.merge(tmp_df, on=['id_encode','ds'], how='left')

# 合并数据
# 将train_df和train_stub_info按照id_encode进行左连接
train_df = train_df.merge(train_stub_info, on='id_encode', how='left')
# 将test_df和test_stub_info按照id_encode进行左连接
test_df = test_df.merge(test_stub_info, on='id_encode', how='left')
(2)数据探索
cols = ['power']  # 绘制图表的列名
for ie in [0,1,2,3,4]:
    # 根据条件筛选出符合条件的行重置索引,将重置后的索引值按升序排列
    tmp_df = train_df[train_df['id_encode']==ie].reset_index(drop=True)
    # 再次对 tmp_df 进行索引重置操作,得到新的索引列 'index'
    tmp_df = tmp_df.reset_index(drop=True).reset_index()

    for num, col in enumerate(cols):
        plt.figure(figsize=(20,10)) # 创建一个大小为 (20, 10) 的图形窗口。
        plt.subplot(4,1,num+1) # 在图形窗口中创建一个子图
        plt.plot(tmp_df['index'],tmp_df[col]) # 绘制折线图
        plt.title(col)  # 标题为列名 col。
plt.show()
plt.figure(figsize=(20,5))  # 创建一个大小为 (20, 5) 的图形窗口
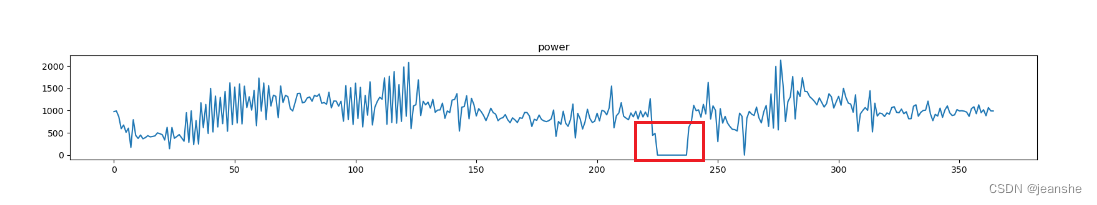
上面展示了一个站点历史一年的用电量数据,可以明显看到异常数据的存在,针对异常数据可以进行前后均值填充、删除对应样本等操作。并且不同站点的用电量存在很大的差异,有的峰值达到3000,有的峰值仅有300。
(3)数据清洗
# 数据预处理
# 将flag为整数,将 'A' 映射为 0,将 'B' 映射为 1
train_df['flag'] = train_df['flag'].map({'A':0,'B':1})
test_df['flag'] = test_df['flag'].map({'A':0,'B':1})
(4)特征工程
def get_time_feature(df, col):
    """
        从指定的列中提取时间特征。
    :param df: 模型
    :param col:
    """
    df_copy = df.copy()      # 复制 DataFrame
    prefix = col + "_"       # 创建一个前缀字符串,用于生成新的时间特征列的列名
    df_copy['new_' + col] = df_copy[col].astype(str)   # 将原始列 col 中的值转换为字符串,并将结果存储在新列 'new_' + col 中
    col = 'new_' + col   # 更新变量
    df_copy[col] = pd.to_datetime(df_copy[col], format='%Y%m%d')  # 将新列 col 中的字符串日期转换为datatime类型,指定日期格式 '%Y%m%d'

    # 创建一系列新的时间特征列
    df_copy[prefix + 'year'] = df_copy[col].dt.year   # 存储了日期的年份
    df_copy[prefix + 'month'] = df_copy[col].dt.month # 存储了日期的月份
    df_copy[prefix + 'day'] = df_copy[col].dt.day     # 存储了日期的日期(即一个月中的几号)
    df_copy[prefix + 'weekofyear'] = df_copy[col].dt.weekofyear    # 存储了日期所在年份的周数
    df_copy[prefix + 'dayofweek'] = df_copy[col].dt.dayofweek     # 存储了日期所在年份的周数
    df_copy[prefix + 'is_wknd'] = df_copy[col].dt.dayofweek // 6  # 存储了日期在一周中的星期几,其中星期一为0,星期天为6
    df_copy[prefix + 'quarter'] = df_copy[col].dt.quarter  # 将星期几转换为布尔值,如果是星期六或星期天为1
    df_copy[prefix + 'is_month_start'] = df_copy[col].dt.is_month_start.astype(int)  # 存储了日期所在年份的季度
    df_copy[prefix + 'is_month_end'] = df_copy[col].dt.is_month_end.astype(int)  # 将日期是否为月初转换为布尔值,如果是月初,则为1,否则为0
    del df_copy[col]   # 删除新列 col

    return df_copy  # 返回时间特征列

train_df = get_time_feature(train_df, 'ds')
test_df = get_time_feature(test_df, 'ds')

cols = [f for f in test_df.columns if f not in ['ds', 'power', 'h3']]
模型训练与验证
def cv_model(clf, train_x, train_y, test_x, seed=2023):
    folds = 5  # 数据集划分为5个交叉验证
    kf = KFold(n_splits=folds, shuffle=True, random_state=seed)  # 实例化KFold
    oof = np.zeros(train_x.shape[0])  # 创建一个形状与训练集样本数相同的全零数组oof,存储每个样本在交叉验证中的预测值。
    test_predict = np.zeros(test_x.shape[0])  # 创建一个形状与测试集样本数相同的全零数组,存储测试集预测结果
    cv_scores = [] # 存储每个验证集的均方根误差(RMSE)评分

    for i, (train_index, valid_index) in enumerate(kf.split(train_x, train_y)):
        """使用kf.split()方法迭代生成每个交叉验证折的训练集和验证集的索引。"""
        print('************************************ {} ************************************'.format(str(i + 1))) # 打印当前交叉验证数
        # 根据当前交叉验证折的索引,从训练集和目标变量中获取对应的训练集特征、训练集目标变量、验证集特征和验证集目标变量
        trn_x, trn_y, val_x, val_y = train_x.iloc[train_index], train_y[train_index], train_x.iloc[valid_index], \
        train_y[valid_index]
        # 用clf.Dataset()方法创建训练集的LightGBM数据集对象train_matrix
        train_matrix = clf.Dataset(trn_x, label=trn_y)
        # 使用clf.Dataset()方法创建验证集的LightGBM数据集对象valid_matrix
        valid_matrix = clf.Dataset(val_x, label=val_y)
        # 使用clf.Dataset()方法创建验证集的LightGBM数据集对象valid_matrix
        params = {
            'boosting_type': 'gbdt',  # boosting类型
            'objective': 'regression', # 目标函数
            'metric': 'rmse',  # 评估指标
            'min_child_weight': 5,
            'num_leaves': 2 ** 7,
            'lambda_l2': 10,
            'feature_fraction': 0.8,
            'bagging_fraction': 0.8,
            'bagging_freq': 4,
            'learning_rate': 0.1,
            'seed': 2023,
            'nthread': 16,
            'verbose': -1,
        }
        # 训练LightGBM模型,训练3000次
        model = clf.train(params, train_matrix, 3000, valid_sets=[train_matrix, valid_matrix],
                          categorical_feature=[])
        # 验证集预测
        val_pred = model.predict(val_x, num_iteration=model.best_iteration)
        # 测试集预测
        test_pred = model.predict(test_x, num_iteration=model.best_iteration)
        # 将验证集的预测结果val_pred赋值给oof数组中对应的索引位置
        oof[valid_index] = val_pred
        # 将当前折的测试集预测结果进行累加,并除以折数kf.n_splits
        test_predict += test_pred / kf.n_splits
        # 计算均方根误差
        score = np.sqrt(mean_squared_error(val_pred, val_y))
        # 添加RMSE评分
        cv_scores.append(score)
        print(cv_scores)

    return oof, test_predict

lgb_oof, lgb_test = cv_model(lgb, train_df[cols], train_df['power'], test_df[cols])

#输出赛题提交格式的结果
test_df['power'] = lgb_test
test_df['power'] = test_df['power'].apply(lambda x: 0 if x<0 else x)
test_df[['id_encode','ds','power']].to_csv('result.csv', index=False)


 901
901

 被折叠的 条评论
为什么被折叠?
被折叠的 条评论
为什么被折叠?
 到【灌水乐园】发言


