


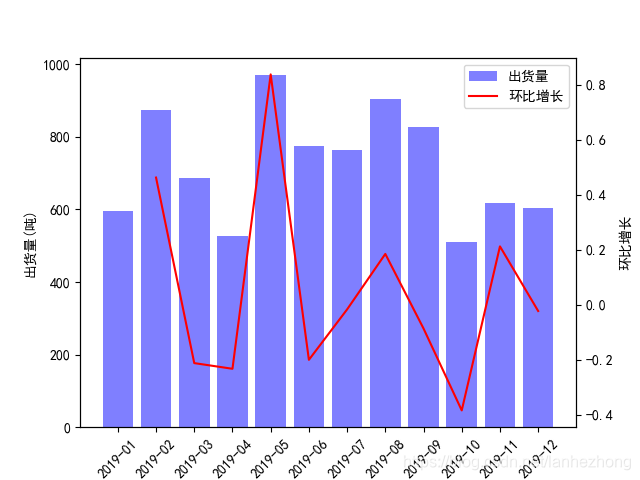
双坐标轴绘图示例
import matplotlib.pyplot as plt
import numpy as np

plt.rcParams['font.sans-serif']=['SimHei']#用来正常显示中文标签
plt.rcParams['axes.unicode_minus']=False#用来正常显示负号

if __name__ == '__main__':
    X=["2019-01", "2019-02", "2019-03", "2019-04", "2019-05", "2019-06", "2019-07", "2019-08", "2019-09", "2019-10", "2019-11", "2019-12"]
    Y1=np.random.randint(500,1000,12)
    Y2=[None]
    for i in range(1,len(Y1)):
        Y2.append((Y1[i]-Y1[i-1])/Y1[i-1])

    fig, ax1 = plt.subplots()
    plt.xticks(rotation=45)

    ax1.bar(X, Y1, color="blue", alpha=0.5, label="出货量")
    ax1.set_xlabel("月份")
    ax1.set_ylabel("出货量(吨)")

    ax2 = ax1.twinx()
    ax2.plot(X, Y2, color="red", label="环比增长")
    ax2.set_ylabel("环比增长")

    fig.legend(loc="upper right", bbox_to_anchor=(1, 1), bbox_transform=ax1.transAxes)
    plt.show()
结果:
代码解释:
1、ax1绘图采用左侧纵轴,ax2绘图采用右侧纵轴。
2、plt.xticks(rotation=45)使x轴刻度文字旋转45度。
3、legend参数解释(可能比较难理解):
bbox_to_anchor=(1, 1)表示图例显示在右上角。其中(0,1)-左上,(1,0)-右下,(0,0)左下。
bbox_transform=ax1.transAxes表示采用ax1的轴域坐标系去确定位置。轴域坐标系:(0,0)是轴域左下角,(1,1)是轴域右上角,和bbox_to_anchor参数对应。
loc="upper right"表示用图例的右上角去对准图例所在位置。


 4165
4165

 被折叠的 条评论
为什么被折叠?
被折叠的 条评论
为什么被折叠?
 到【灌水乐园】发言


