


figure(1);
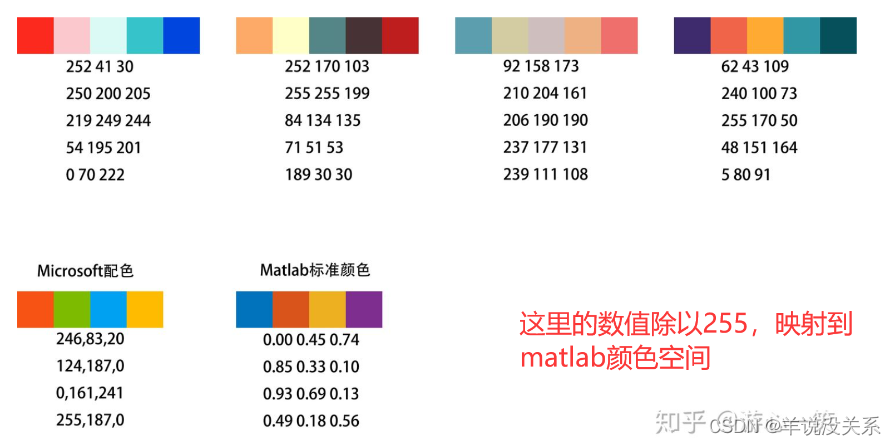
plot(x,data4,'--o','MarkerFaceColor',[0, 0.45, 0.74]);
hold on;
plot(x,data2,'-+','MarkerFaceColor',[0.85, 0.33, 0.10]);
xlim([95 210])
plot(x,data1,'-.*','MarkerFaceColor',[0.93, 0.69, 0.13]);
hold on;
plot(x,data3,':x','MarkerFaceColor',[0.49, 0.18, 0.56]);
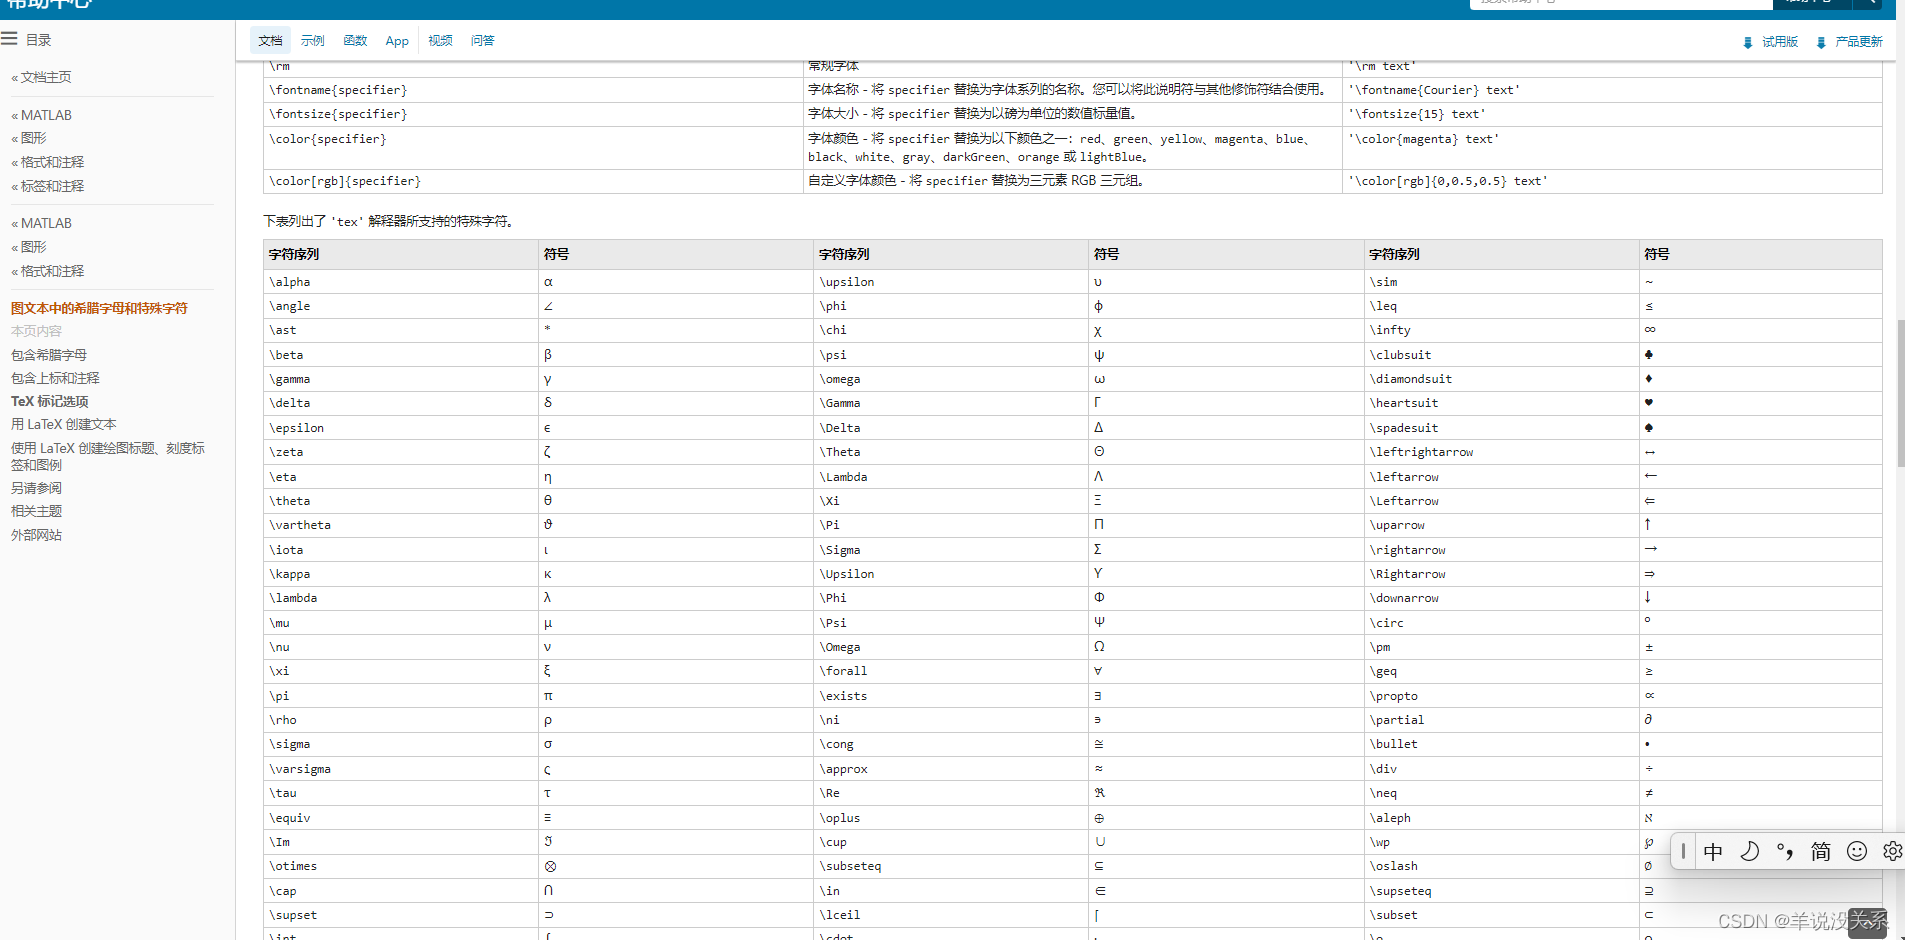
https://ww2.mathworks.cn/help/matlab/creating_plots/greek-letters-and-special-characters-in-graph-text.html
%%
1. 一幅图多个图像,使用hold on
2. 改变图像线条粗细和颜色使用命令’plot(x,b,'-^','Color',[0,0,0],'linewidth',1);‘
3. 改变线框字体大小’set(gca,'FontSize',16);‘
4. 改变线框粗细,'set(gca,'FontSize',16);'
5.
%%
clc;
close all;
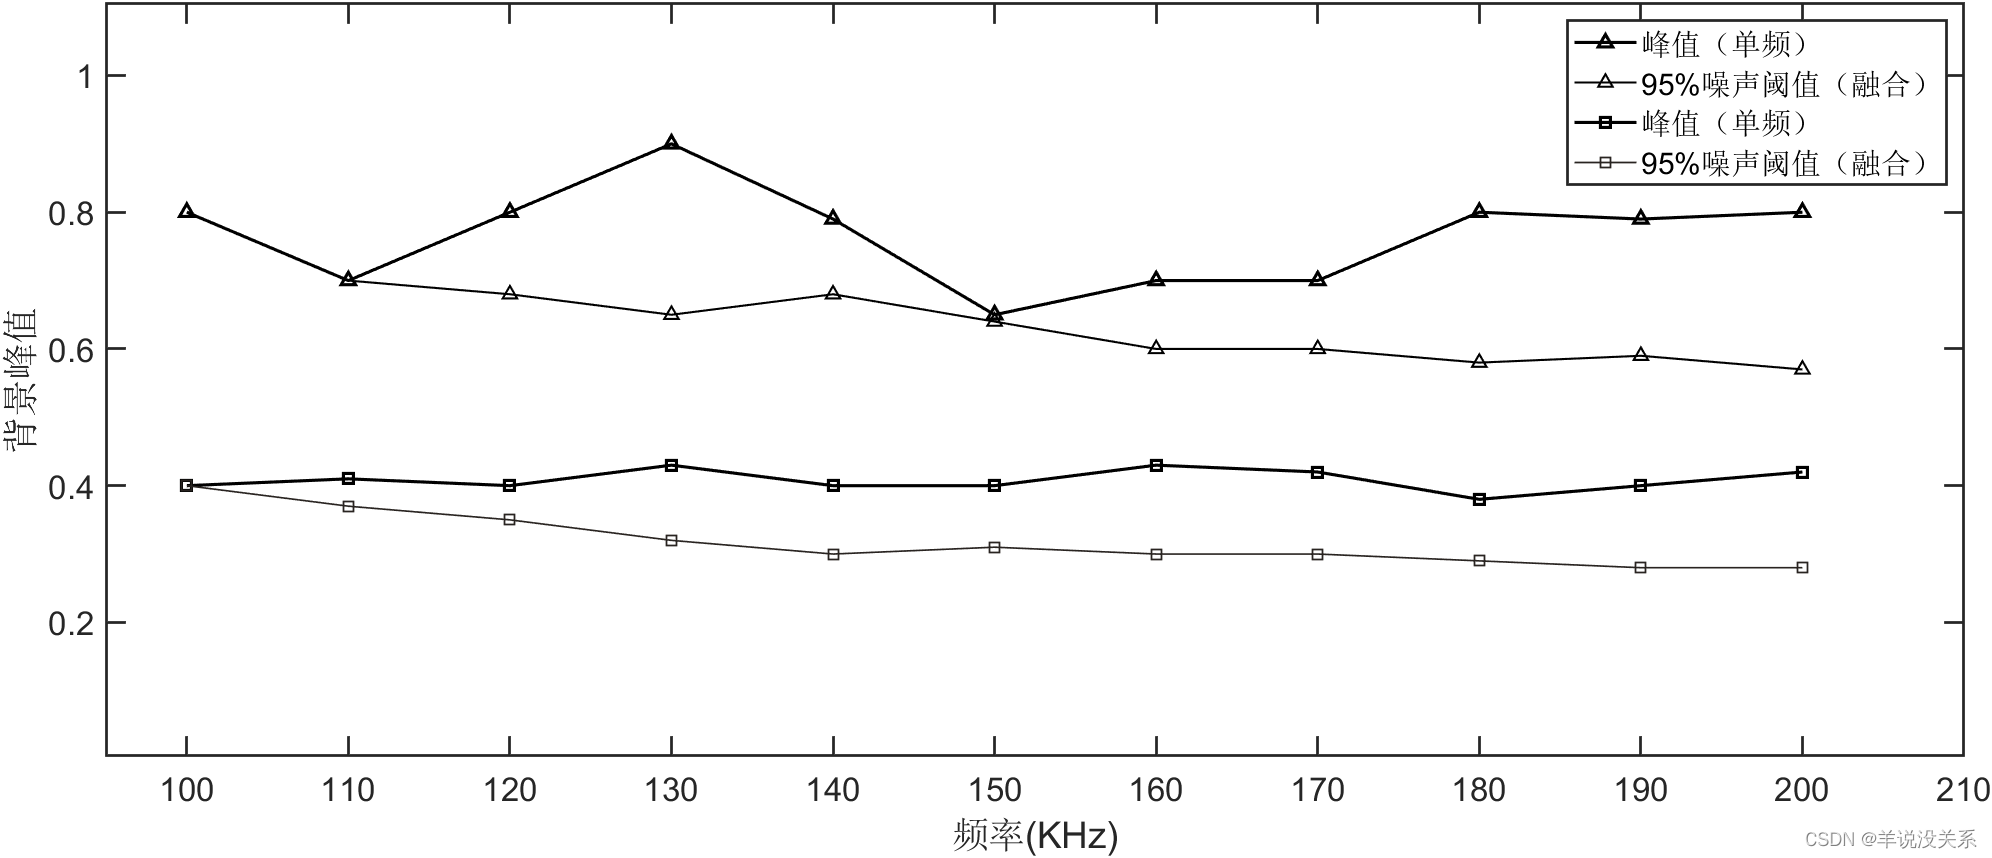
a=[0.8,0.7,0.8,0.9,0.79,0.65,0.7,0.7,0.8,0.79,0.8];
b=[0.8,0.7,0.68,0.65,0.68,0.64,0.6,0.6,0.58,0.59,0.57];
c=[0.4,0.41,0.4,0.43,0.4,0.4,0.43,0.42,0.38,0.4,0.42];
d=[0.4,0.37,0.35 ,0.32,0.3,0.31,0.3,0.3,0.29,0.28,0.28];
x=100:10:200;
figure(1);
plot(x,a,'k-^','linewidth',1.5);
hold on;
plot(x,b,'-^','Color',[0,0,0],'linewidth',1);
xlim([95 210])
ylim([0 1.1])
plot(x,c,'k-s','linewidth',1.5);
hold on;
plot(x,d,'-s','Color',[0.16,0.14,0.13],'linewidth',0.8);
set(gca,'linewidth',1.3);
set(gca,'FontSize',16);
legend('峰值(单频)','95%噪声阈值(融合)','峰值(单频)','95%噪声阈值(融合)');
hold off;
xlabel('频率(KHz)')
ylabel('背景峰值')
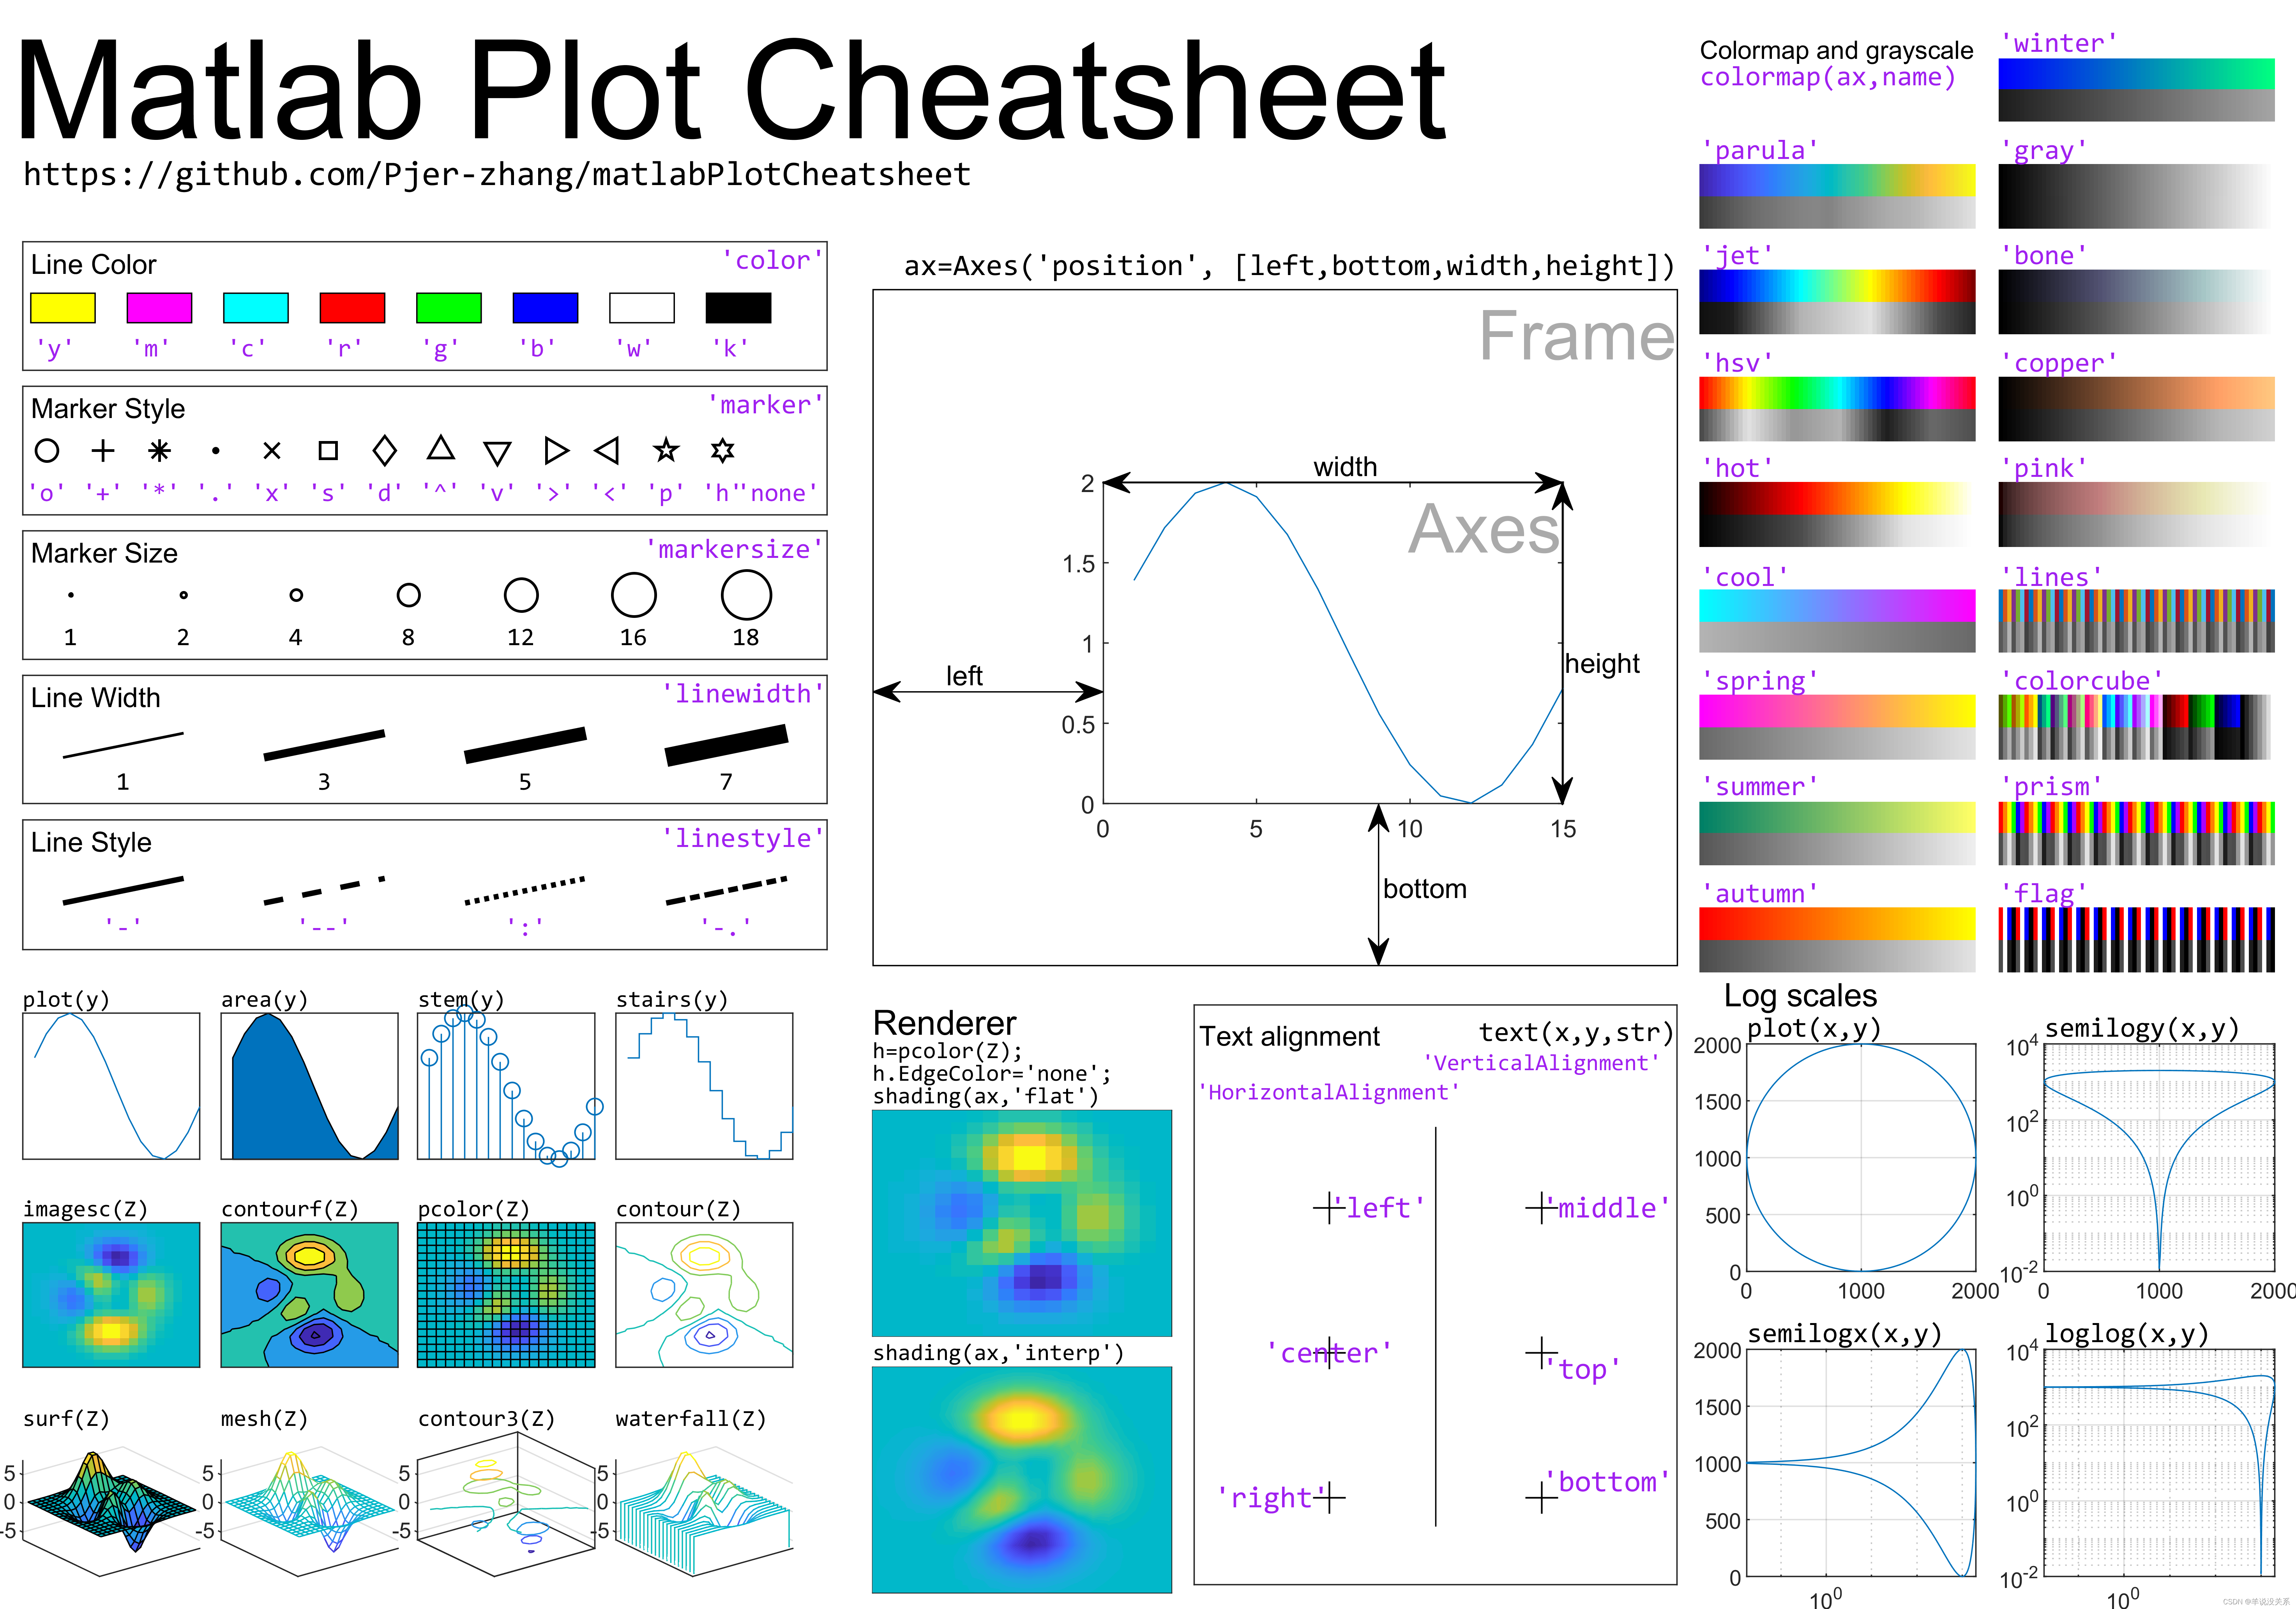
散点标志符号
+加号
o 圆圈
*星号
. 实心点
x 叉号
s 正方形
d 钻石形
^ 上三角形
v 下三角形
<左三角形
p五角星形
h六角星形
绘图大全
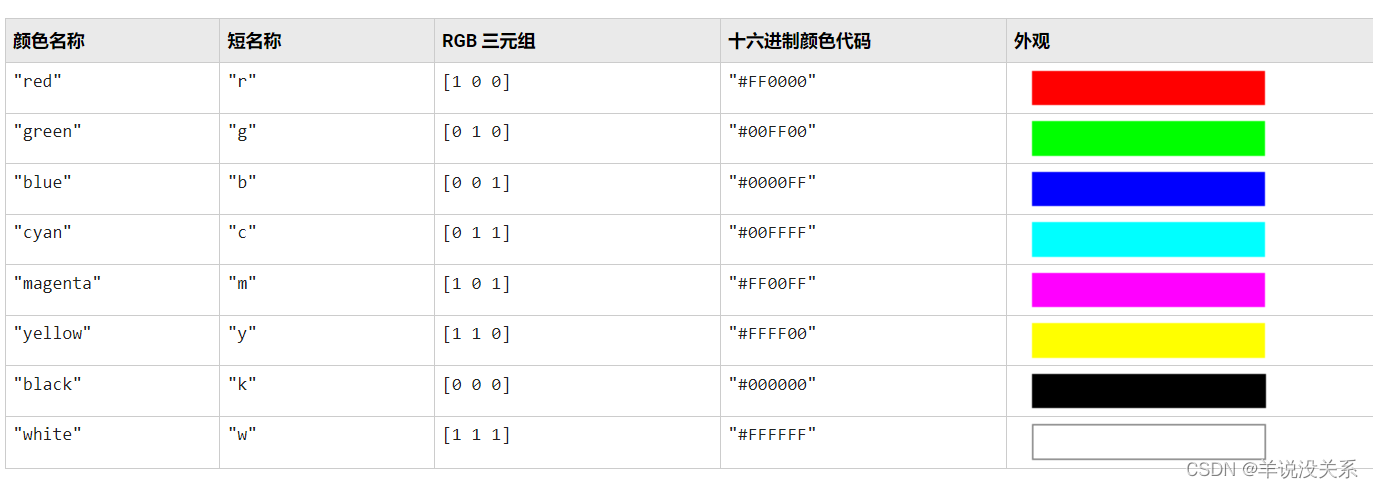
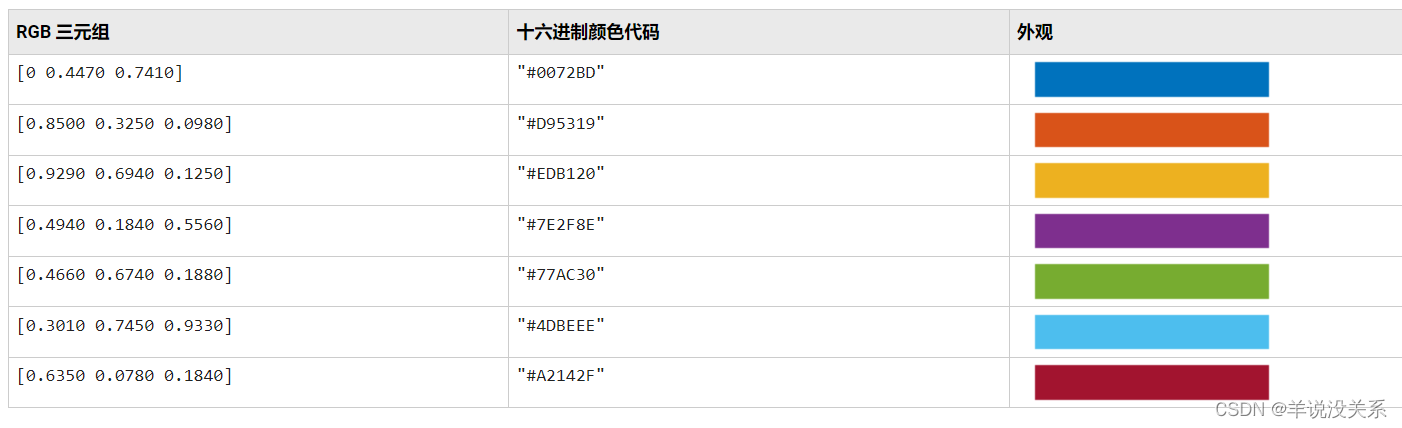
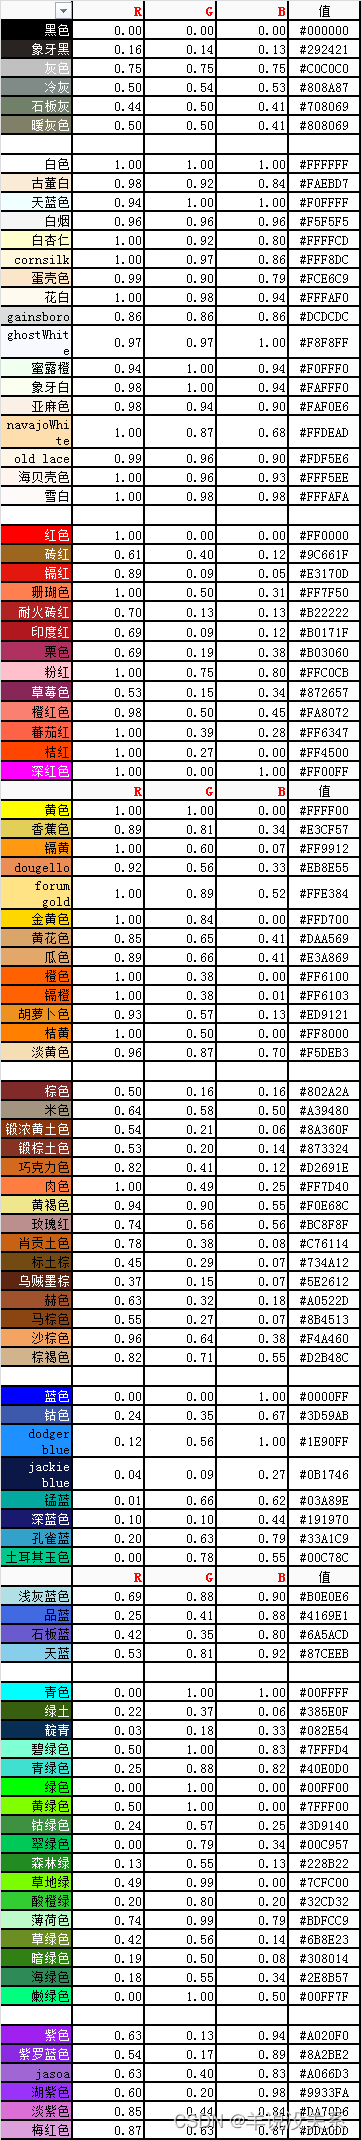
颜色大全


 2万+
2万+


 被折叠的 条评论
为什么被折叠?
被折叠的 条评论
为什么被折叠?
 到【灌水乐园】发言


