解决问题:在一个图中画多个子图,又能自己确定子图的大小和位置。
解决方法:有两种解决方法可以实现:
- 使用subplot命令
- 使用axes函数来重新规定子图的大小和位置。
这两种方法中,第一种方法相对简单,但是第二种方法更加灵活,具体使用如下:
第一种方法:使用subplot
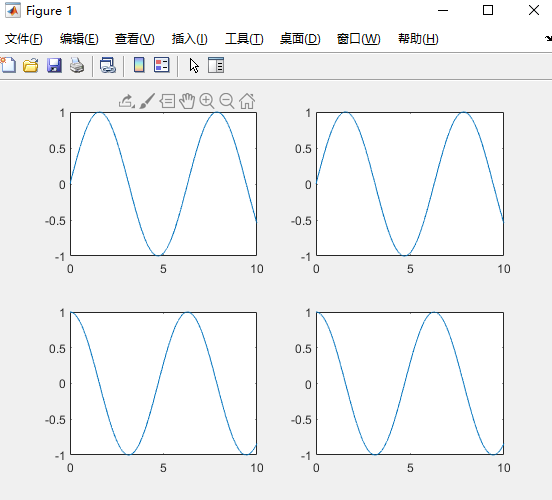
先看一下subplot的简单使用,程序如下:
| 1 2 3 4 5 6 7 8 9 10 11 12 13 14 15 16 | clear;
clc;
close all;
t = 0:0.001:10;
y1 = sin(t);
y2 = cos(t);
figure (1);
subplot(2,2,1)
plot(t,y1);
subplot(2,2,2)
plot(t,y1);
subplot(2,2,3)
plot(t,y2);
subplot(2,2,4)
plot(t,y2);
|
程序运行结果:
使用subplot的这种方法,如果想要自定义子图的大小和位置该怎么设置?matlab画图工具
程序如下:
| 1 2 3 4 5 6 7 8 9 10 11 12 | clear;
clc;
close all;
t = 0:0.001:10;
y1 = sin(t);
y2 = cos(t);
figure(1);
subplot('position',[0.2,0.7,0.6,0.2]);
plot(t,y1);
subplot('position',[0.2,0.2,0.6,0.2]);
plot(t,y2);
|
程序运行结果:

第二种方法:直接使用axes函数
程序如下:
| 1 2 3 4 5 6 7 8 9 10 11 12 13 14 15 16 | clear;
clc;
close all;
t = 0:0.001:10;
y1 = sin(t);
y2 = cos(t);
figure (1);
axes('position',[0.1 0.6 0.3 0.3]);
plot(t,y1);
axes('position',[0.6 0.6 0.3 0.3]);
plot(t,y1);
axes('position',[0.1 0.1 0.3 0.3]);
plot(t,y2);
axes('position',[0.6 0.1 0.3 0.3]);
plot(t,y2);
|
程序运行结果:
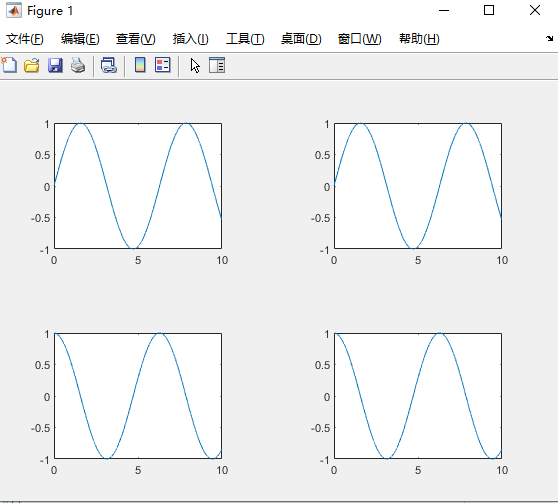
其中,'position',[0.6 0.1 0.3 0.3]的含义可以参考我之前的博客文章,有详细说明;
如果要自定义整个figure的大小,设置gcf,我之前的博客文章也有详细说明。


 5万+
5万+

 被折叠的 条评论
为什么被折叠?
被折叠的 条评论
为什么被折叠?
 到【灌水乐园】发言


