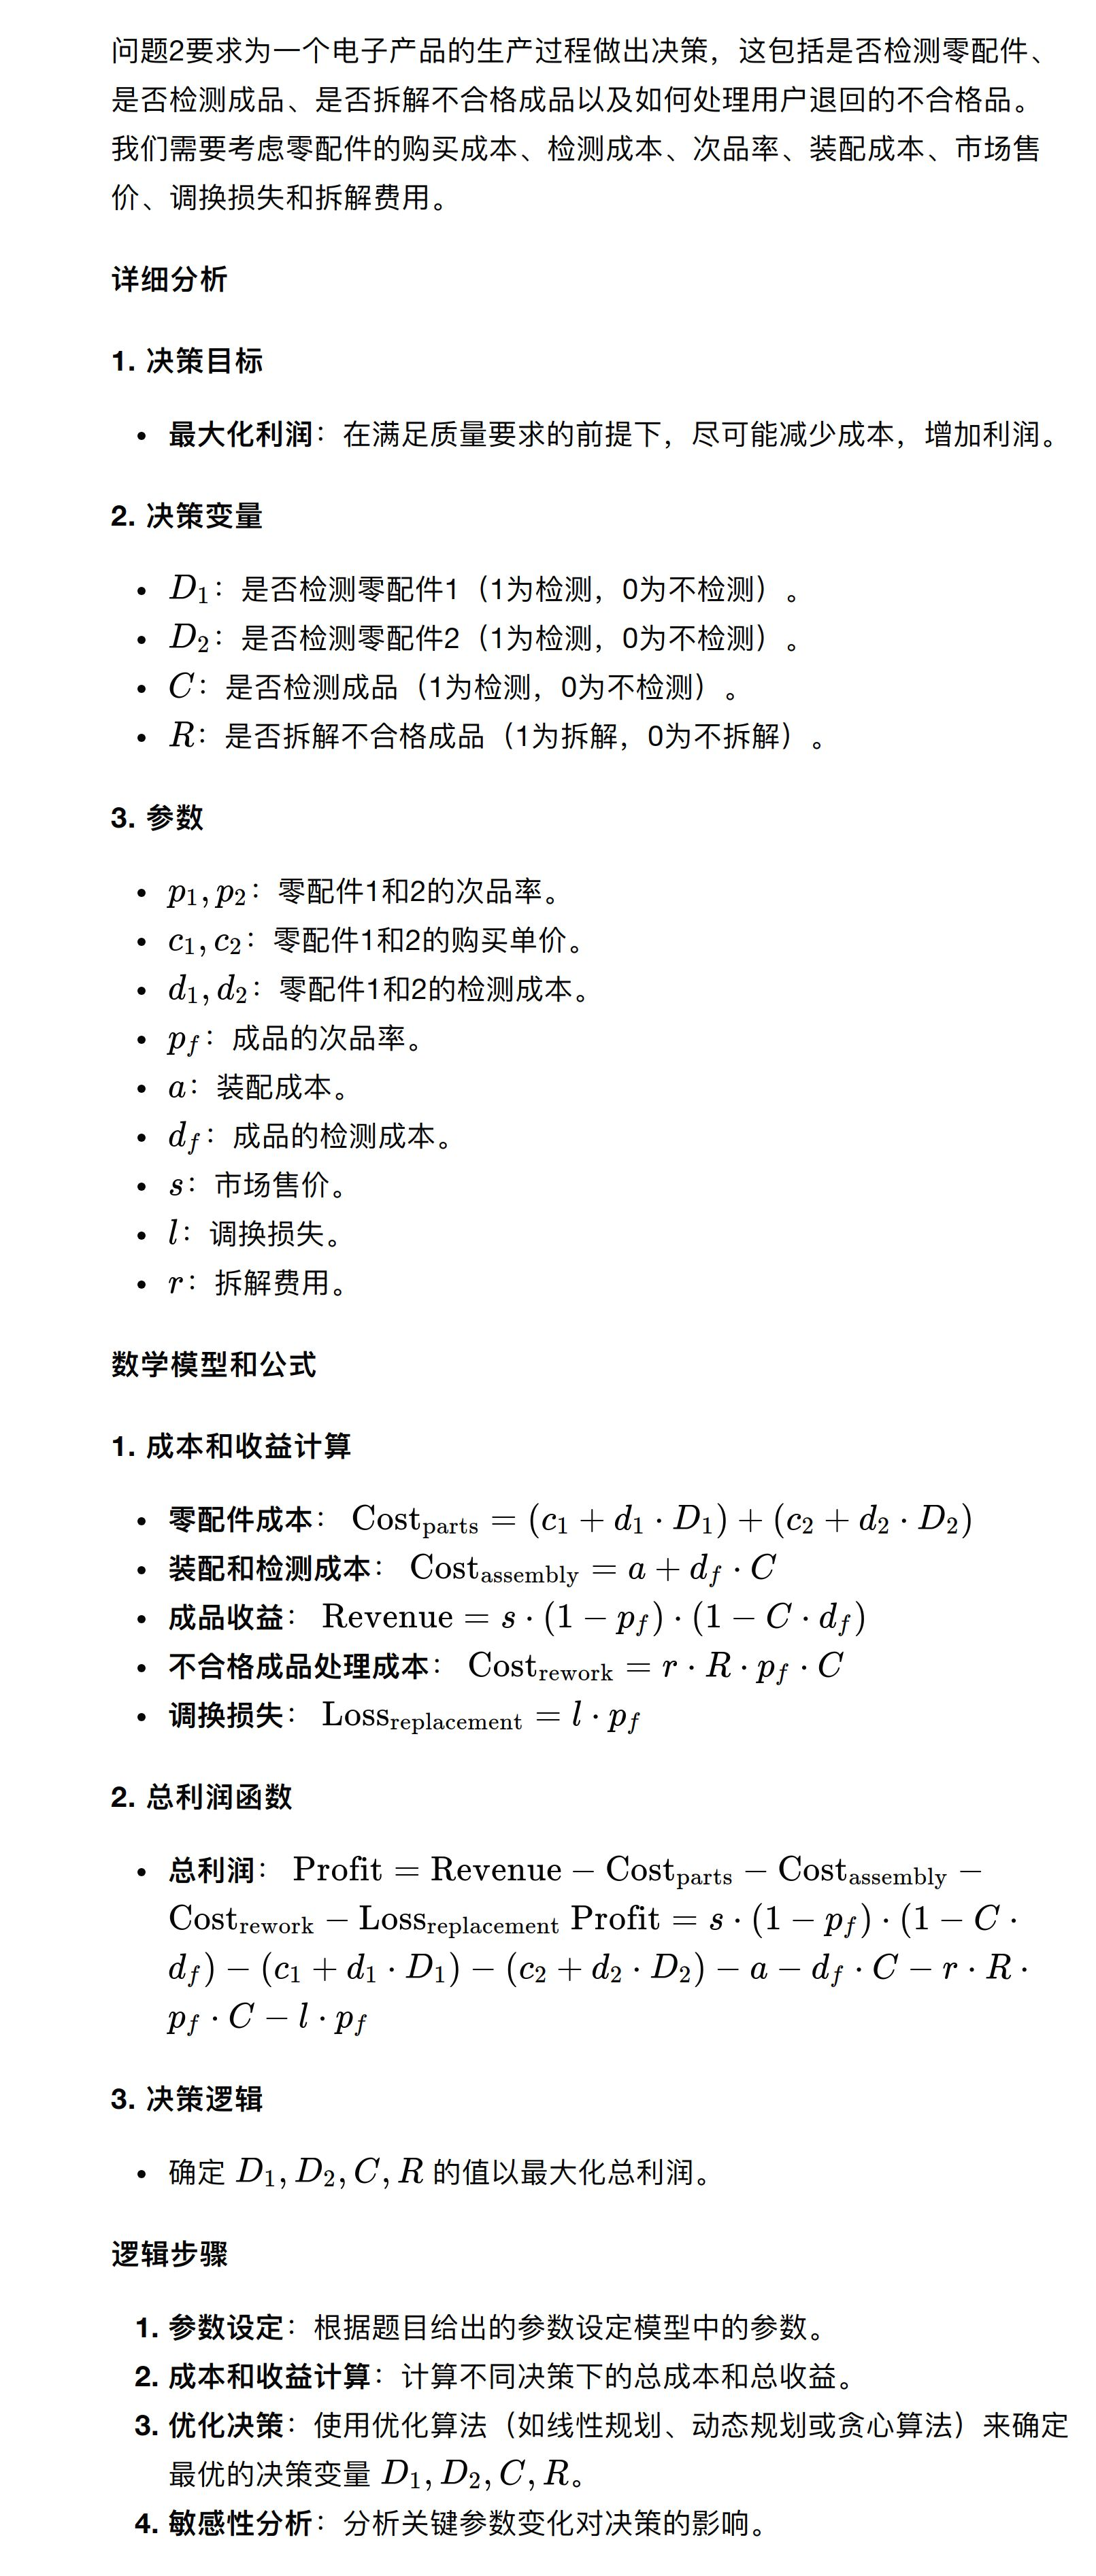
2024 年高教社杯全国大学生数学建模竞赛B题第二问详细解题思路(终版)

示例代码:

import numpy as np
import pandas as pd

# 参数设定
params = {
    'p1': 0.10, 'p2': 0.10, 'c1': 4, 'c2': 2, 'd1': 2, 'd2': 3,
    'pf': 0.10, 'a': 6, 'df': 3, 's': 56, 'l': 6, 'r': 5
}

# 决策变量
decisions = [0, 1]

# 利润计算函数
def calculate_profit(D1, D2, C, R, params):
    cost_parts = (params['c1'] + params['d1'] * D1) + (params['c2'] + params['d2'] * D2)
    cost_assembly = params['a'] + params['df'] * C
    revenue = params['s'] * (1 - params['pf']) * (1 - C * params['df'])
    cost_rework = params['r'] * R * params['pf'] * C
    loss_replacement = params['l'] * params['pf']
    profit = revenue - cost_parts - cost_assembly - cost_rework - loss_replacement
    return profit

# 遍历所有可能的决策组合
best_profit = -np.inf
best_decision = None
for D1 in decisions:
    for D2 in decisions:
        for C in decisions:
            for R in decisions:
                profit = calculate_profit(D1, D2, C, R, params)
                if profit > best_profit:
                    best_profit = profit
                    best_decision = (D1, D2, C, R)

print(f"Best Decision: {best_decision}, Maximum Profit: {best_profit}")

可视化代码:

import numpy as np
import matplotlib.pyplot as plt
import itertools

# 参数设定
params = {
    'p1': 0.10, 'p2': 0.10, 'c1': 4, 'c2': 2, 'd1': 2, 'd2': 3,
    'pf': 0.10, 'a': 6, 'df': 3, 's': 56, 'l': 6, 'r': 5
}

# 决策变量
decisions = [0, 1]

# 利润计算函数
def calculate_profit(D1, D2, C, R, params):
    cost_parts = (params['c1'] + params['d1'] * D1) + (params['c2'] + params['d2'] * D2)
    cost_assembly = params['a'] + params['df'] * C
    revenue = params['s'] * (1 - params['pf']) * (1 - C * params['df'])
    cost_rework = params['r'] * R * params['pf'] * C
    loss_replacement = params['l'] * params['pf']
    profit = revenue - cost_parts - cost_assembly - cost_rework - loss_replacement
    return profit

# 遍历所有可能的决策组合
profits = []
decision_combinations = list(itertools.product(decisions, repeat=4))
for combo in decision_combinations:
    profit = calculate_profit(*combo, params)
    profits.append(profit)

# 转换为DataFrame以便可视化
df = pd.DataFrame(decision_combinations, columns=['D1', 'D2', 'C', 'R'])
df['Profit'] = profits

# 绘制成本与收益分析图
plt.figure(figsize=(10, 6))
plt.bar(df.index, df['Profit'], color='skyblue')
plt.xlabel('Decision Combination Index')
plt.ylabel('Profit')
plt.title('Profit for Different Decision Combinations')
plt.xticks(rotation=90)
plt.show()

# 决策影响图
for i, decision in enumerate(['D1', 'D2', 'C', 'R']):
    plt.figure(figsize=(10, 6))
    plt.bar(df.index, df['Profit'] * (df[decision] == 1).astype(int), label=f'{decision} = 1')
    plt.bar(df.index, df['Profit'] * (df[decision] == 0).astype(int), bottom=df['Profit'] * (df[decision] == 1).astype(int), label=f'{decision} = 0')
    plt.xlabel('Decision Combination Index')
    plt.ylabel('Profit')
    plt.title(f'Impact of {decision} on Profit')
    plt.legend()
    plt.xticks(rotation=90)
    plt.show()

# 敏感性分析图
sensitivity_params = ['c1', 'c2', 's', 'l', 'r']
for param in sensitivity_params:
    values = np.linspace(0.5, 1.5, 10) * params[param]
    profits_sensitivity = [calculate_profit(1, 1, 1, 1, {**params, param: value}) for value in values]
    plt.figure(figsize=(10, 6))
    plt.plot(values, profits_sensitivity, marker='o', label=f'Sensitivity to {param}')
    plt.xlabel(f'{param} Value')
    plt.ylabel('Profit')
    plt.title(f'Sensitivity Analysis for {param}')
    plt.legend()
    plt.grid(True)
    plt.show()

图表说明:

  1. 成本与收益分析图:展示了所有可能的决策组合下的总利润,帮助理解不同决策对利润的影响。
  2. 决策影响图:分别展示了每个决策变量(检测零配件1、检测零配件2、检测成品、拆解不合格成品)对总利润的影响。
  3. 敏感性分析图:展示了关键参数(如零配件成本、市场售价、调换损失、拆解费用)变化对总利润的影响,帮助理解哪些参数对决策影响最大。

这些图表可以帮助更直观地理解不同决策和参数变化对生产过程利润的影响,从而做出更合理的决策。

  • 10
    点赞
  • 6
    收藏
    觉得还不错? 一键收藏
  • 0
    评论
评论
添加红包

请填写红包祝福语或标题

红包个数最小为10个

红包金额最低5元

当前余额3.43前往充值 >
需支付:10.00
成就一亿技术人!
领取后你会自动成为博主和红包主的粉丝 规则
hope_wisdom
发出的红包
实付
使用余额支付
点击重新获取
扫码支付
钱包余额 0

抵扣说明:

1.余额是钱包充值的虚拟货币,按照1:1的比例进行支付金额的抵扣。
2.余额无法直接购买下载,可以购买VIP、付费专栏及课程。

余额充值