


#EasyCharts团队出品,
#如有问题修正与深入学习,可联系微信:EasyCharts
library(ggplot2)
mydata<-read.csv("Scatter_Data.csv",stringsAsFactors=FALSE)
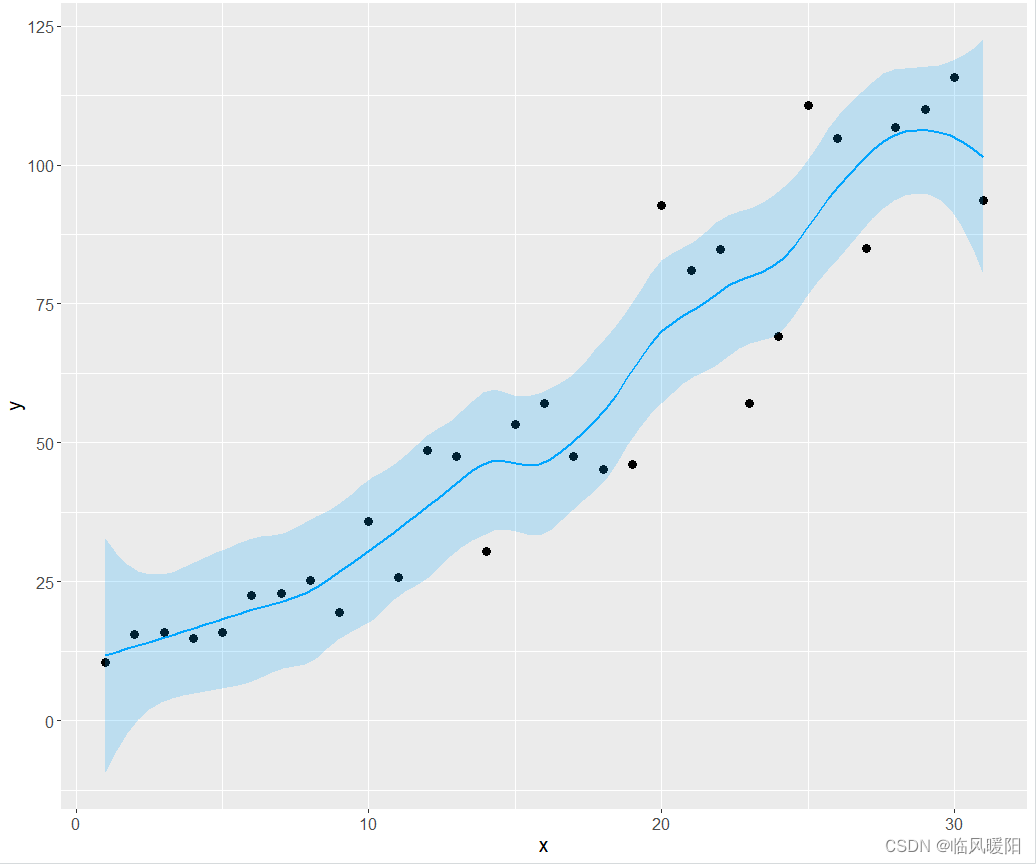
ggplot(data = mydata, aes(x,y)) +
geom_point(fill="black",colour="black",size=3,shape=21) +
#geom_smooth(method="lm",se=TRUE,formula=y ~ splines::bs(x, 5),colour="red")+ #(h)
#geom_smooth(method = 'gam',formula=y ~s(x))+ #(g)
geom_smooth(method = 'loess',span=0.4,se=TRUE,colour="#00A5FF",fill="#00A5FF",alpha=0.2)+ #(f)
scale_y_continuous(breaks = seq(0, 125, 25))+
theme(
text=element_text(size=15,color="black"),
plot.title=element_text(size=15,family="myfont",hjust=.5,color="black"),
legend.position="none"
)
开发工具:RStudio与微信Alt+A截屏工具
参考文献:https://download.csdn.net/download/weixin_39840588/11515554?utm_medium=notify.im.downloadSource.a&username=m0_38127487


 1370
1370


 被折叠的 条评论
为什么被折叠?
被折叠的 条评论
为什么被折叠?
 到【灌水乐园】发言


