library(ggplot2)
library(RColorBrewer)
library(ggrepel)
attach(mtcars)
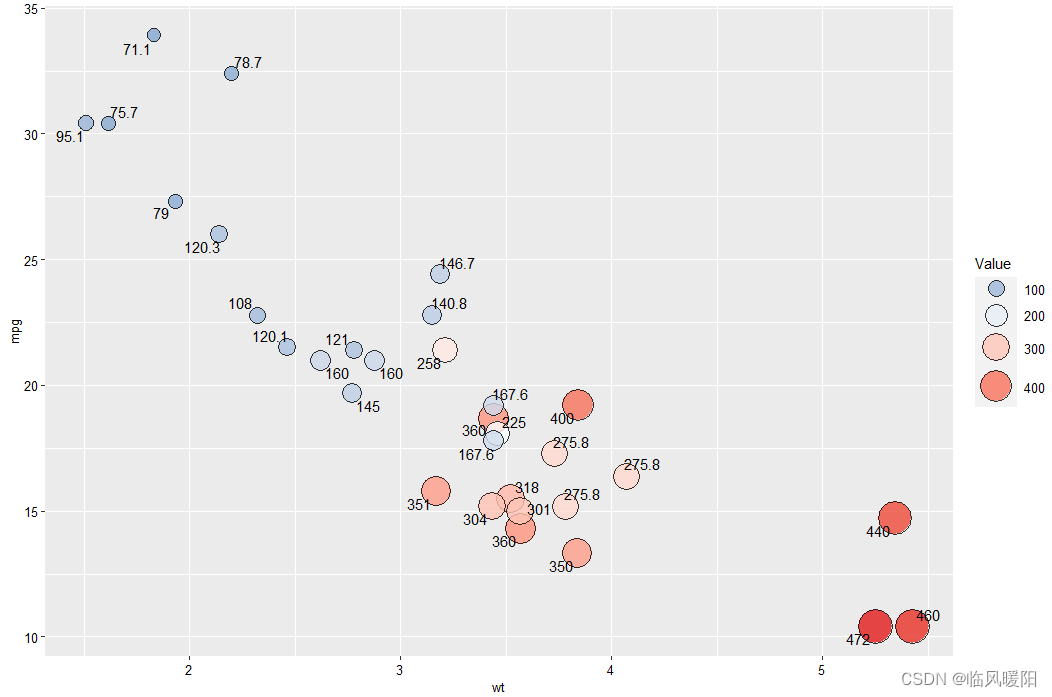
ggplot(data=mtcars, aes(x=wt,y=mpg))+
geom_point(aes(size=disp,fill=disp),shape=21,colour="black",alpha=0.8)+
scale_fill_gradient2(low="#377EB8",high="#E41A1C",midpoint = mean(mtcars$disp))+
geom_text_repel(label = disp )+
scale_size_area(max_size=12)+
guides(size = guide_legend((title="Value")),
fill = guide_legend((title="Value")))+
theme(
legend.text=element_text(size=10,face="plain",color="black"),
axis.title=element_text(size=10,face="plain",color="black"),
axis.text = element_text(size=10,face="plain",color="black"),
legend.position = "right"
)
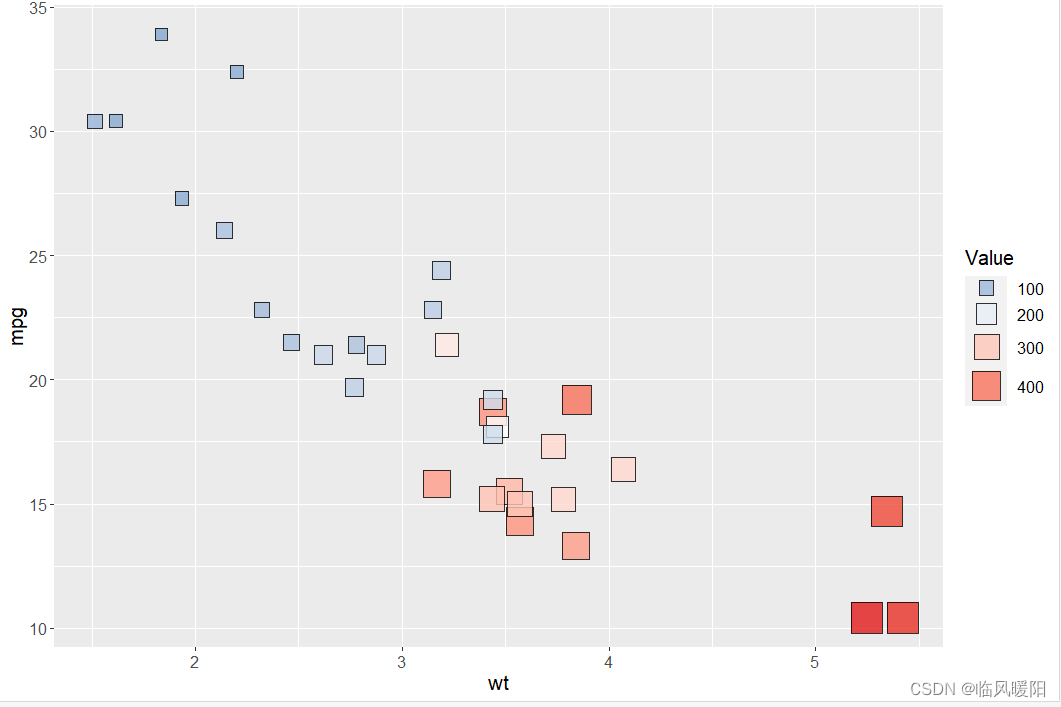
ggplot(mtcars, aes(wt,mpg))+
geom_point(aes(size=disp,fill=disp),shape=22,colour="black",alpha=0.8)+
scale_fill_gradient2(low=brewer.pal(7,"Set1")[2],high=brewer.pal(7,"Set1")[1],
midpoint = mean(mtcars$disp))+
scale_size_area(max_size=12)+
guides(fill = guide_legend((title="Value")),
size = guide_legend((title="Value")))+
theme(
text=element_text(size=15,color="black"),
plot.title=element_text(size=15,family="myfont",face="bold.italic",color="black")
)


 6351
6351


 被折叠的 条评论
为什么被折叠?
被折叠的 条评论
为什么被折叠?
 到【灌水乐园】发言


