


figure('Position',[350 275 300 200]);
%建立左方的子图,则semilogx绘制的资料绘于其内
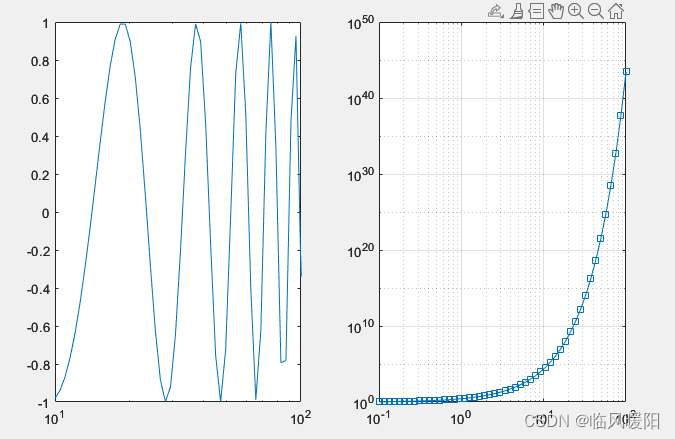
subplot(121)
theta=logspace(1,2);
r=cos(theta/3);
semilogx(theta,r)
%建立右方的子图,则loglog绘制的资料绘于其内
subplot(122);
x=logspace(-1,2);
loglog(x,exp(x),'-s');
grid on
开发工具:MATLAB 2022b
微信Alt+A截屏工具
本程序摘自《MATLAB 20085图形与动画实例教程》


 965
965


 被折叠的 条评论
为什么被折叠?
被折叠的 条评论
为什么被折叠?
 到【灌水乐园】发言


