


目录
1. Harris角点检测算法
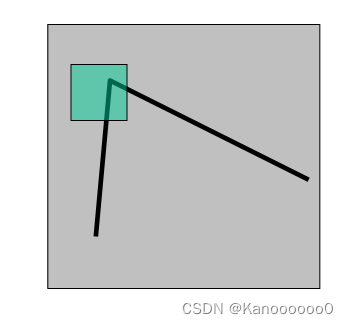
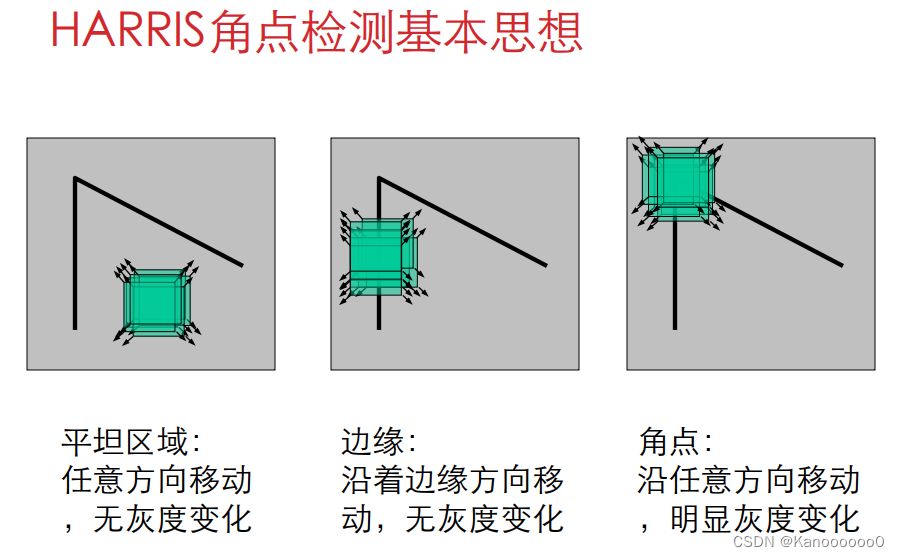
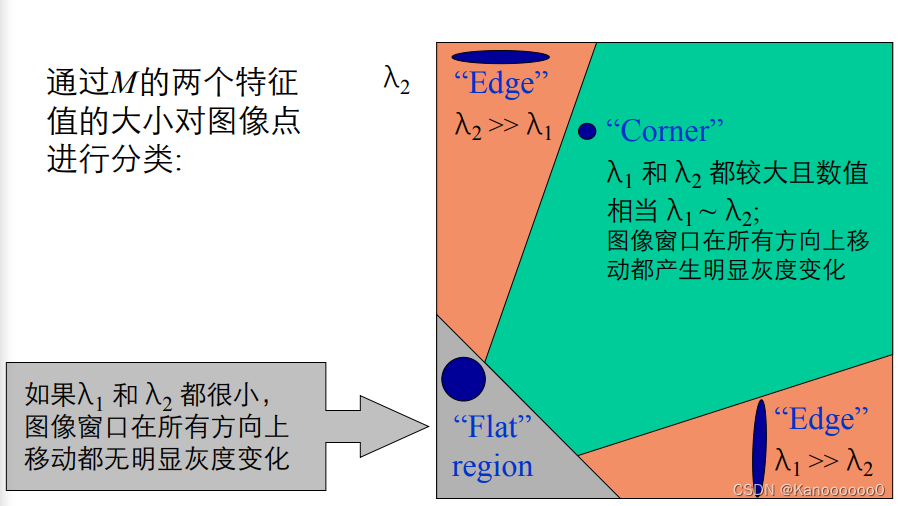
1.1 Harris角点检测算法的基本思想
从图像局部的小窗口观察图像特征。
角点定义:窗口向任意方向的移动都导致图像灰度的明显变化。
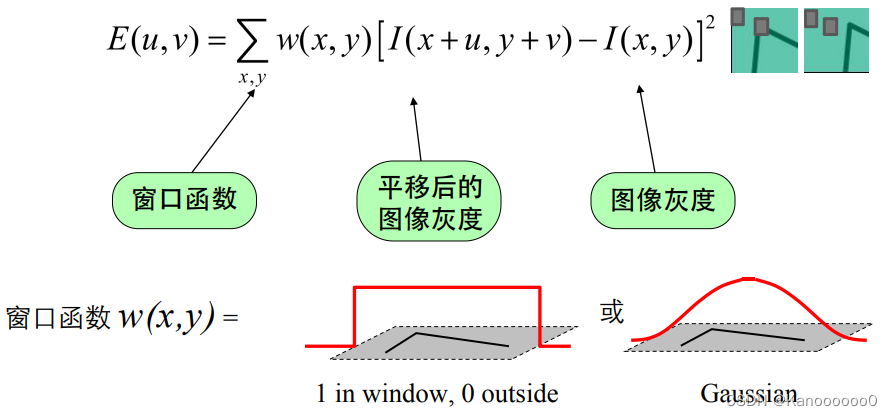
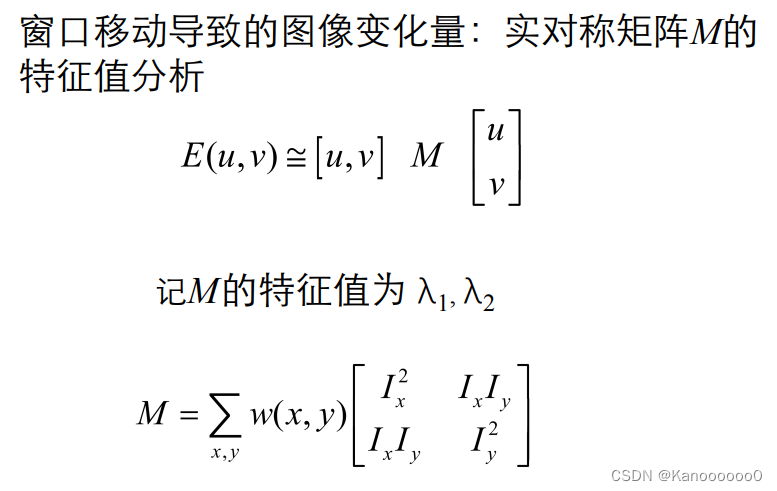
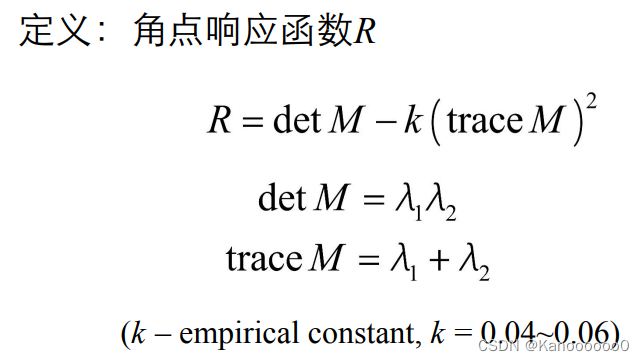
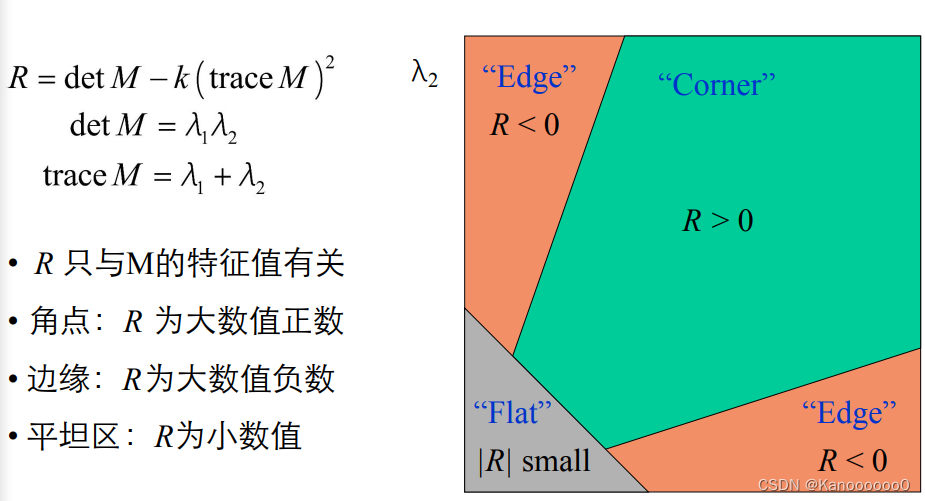
 1.2 Harris角点检测算法的数学表达
将图像窗口平移[u,v]产生灰度变化E(u,v)。
1.3 Harris角点检测算法的代码实现
from pylab import *
from numpy import *
from scipy.ndimage import filters
from PIL import Image
def compute_harris_response(im,sigma=3):
""" Compute the Harris corner detector response function
for each pixel in a graylevel image. """
# derivatives
imx = zeros(im.shape)
filters.gaussian_filter(im, (sigma,sigma), (0,1), imx)
imy = zeros(im.shape)
filters.gaussian_filter(im, (sigma,sigma), (1,0), imy)
# compute components of the Harris matrix
Wxx = filters.gaussian_filter(imx*imx,sigma)
Wxy = filters.gaussian_filter(imx*imy,sigma)
Wyy = filters.gaussian_filter(imy*imy,sigma)
# determinant and trace
Wdet = Wxx*Wyy - Wxy**2
Wtr = Wxx + Wyy
return Wdet / Wtr
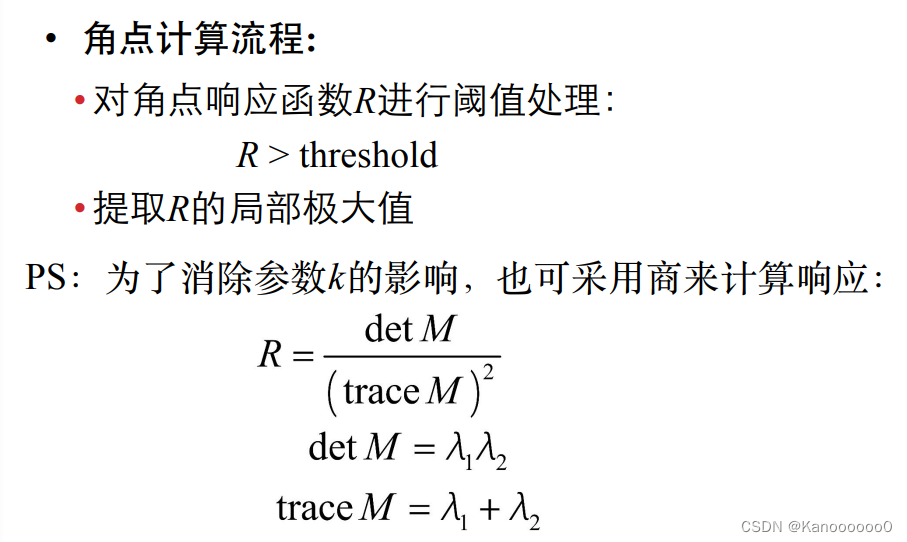
def get_harris_points(harrisim,min_dist=10,threshold=0.1):
""" Return corners from a Harris response image
min_dist is the minimum number of pixels separating
corners and image boundary. """
# find top corner candidates above a threshold
corner_threshold = harrisim.max() * threshold
harrisim_t = (harrisim > corner_threshold) * 1
# get coordinates of candidates
coords = array(harrisim_t.nonzero()).T
# ...and their values
candidate_values = [harrisim[c[0],c[1]] for c in coords]
# sort candidates (reverse to get descending order)
index = argsort(candidate_values)[::-1]
# store allowed point locations in array
allowed_locations = zeros(harrisim.shape)
allowed_locations[min_dist:-min_dist,min_dist:-min_dist] = 1
# select the best points taking min_distance into account
filtered_coords = []
for i in index:
if allowed_locations[coords[i,0],coords[i,1]] == 1:
filtered_coords.append(coords[i])
allowed_locations[(coords[i,0]-min_dist):(coords[i,0]+min_dist),
(coords[i,1]-min_dist):(coords[i,1]+min_dist)] = 0
return filtered_coords
def plot_harris_points(image,filtered_coords):
""" Plots corners found in image. """
figure()
gray()
imshow(image)
plot([p[1] for p in filtered_coords],
[p[0] for p in filtered_coords],'*')
axis('off')
show()
def get_descriptors(image,filtered_coords,wid=5):
""" For each point return pixel values around the point
using a neighbourhood of width 2*wid+1. (Assume points are
extracted with min_distance > wid). """
desc = []
for coords in filtered_coords:
patch = image[coords[0]-wid:coords[0]+wid+1,
coords[1]-wid:coords[1]+wid+1].flatten()
desc.append(patch)
return desc
def match(desc1,desc2,threshold=0.5):
""" For each corner point descriptor in the first image,
select its match to second image using
normalized cross correlation. """
n = len(desc1[0])
# pair-wise distances
d = -ones((len(desc1),len(desc2)))
for i in range(len(desc1)):
for j in range(len(desc2)):
d1 = (desc1[i] - mean(desc1[i])) / std(desc1[i])
d2 = (desc2[j] - mean(desc2[j])) / std(desc2[j])
ncc_value = sum(d1 * d2) / (n-1)
if ncc_value > threshold:
d[i,j] = ncc_value
ndx = argsort(-d)
matchscores = ndx[:,0]
return matchscores
def match_twosided(desc1,desc2,threshold=0.5):
""" Two-sided symmetric version of match(). """
matches_12 = match(desc1,desc2,threshold)
matches_21 = match(desc2,desc1,threshold)
ndx_12 = where(matches_12 >= 0)[0]
# remove matches that are not symmetric
for n in ndx_12:
if matches_21[matches_12[n]] != n:
matches_12[n] = -1
return matches_12
def appendimages(im1,im2):
""" Return a new image that appends the two images side-by-side. """
# select the image with the fewest rows and fill in enough empty rows
rows1 = im1.shape[0]
rows2 = im2.shape[0]
if rows1 < rows2:
im1 = concatenate((im1,zeros((rows2-rows1,im1.shape[1]))),axis=0)
elif rows1 > rows2:
im2 = concatenate((im2,zeros((rows1-rows2,im2.shape[1]))),axis=0)
# if none of these cases they are equal, no filling needed.
return concatenate((im1,im2), axis=1)
def plot_matches(im1,im2,locs1,locs2,matchscores,show_below=True):
""" Show a figure with lines joining the accepted matches
input: im1,im2 (images as arrays), locs1,locs2 (feature locations),
matchscores (as output from 'match()'),
show_below (if images should be shown below matches). """
im3 = appendimages(im1,im2)
if show_below:
im3 = vstack((im3,im3))
imshow(im3)
cols1 = im1.shape[1]
for i,m in enumerate(matchscores):
if m>0:
plot([locs1[i][1],locs2[m][1]+cols1],[locs1[i][0],locs2[m][0]],'c')
axis('off')
if __name__ == '__main__':
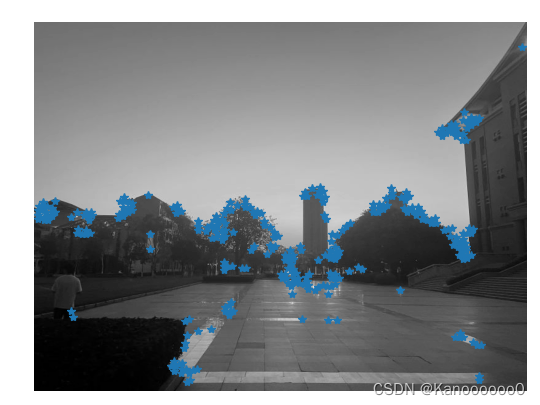
im = array(Image.open('C:\\Users\\Kano\\Desktop\\1.jpg').convert('L'))
harrisim = compute_harris_response(im)
filtered_coords = get_harris_points(harrisim,6)
plot_harris_points(im, filtered_coords)
2. SIFT算法
2.1 SIFT算法的基本原理
SIFT算法是在图像尺度空间的基础上,提出了对图像缩放、旋转保持不变形的图像局部特征描述算子—SIFT(尺度不变特征变换)。
SIFT算法可以解决的问题
1.目标的旋转、缩放、平移(RST)
2.图像仿射、投影变换(视点viewpoint)
3.弱光照影响(illumination)
4.部分目标遮挡(occlusion)
5.杂物场景(clutter)
6.噪声(noise)
SIFT算法实现步骤简述:
实质可以归为在不同尺度空间上查找特征点(关键点)的问题。SIFT算法实现特征匹配主要有三个流程,1、提取关键点;2、对关键点附加 详细的信息(局部特征),即描述符;3、通过特征点(附带上特征向量的关 键点)的两两比较找出相互匹配的若干对特征点,建立景物间的对应关系。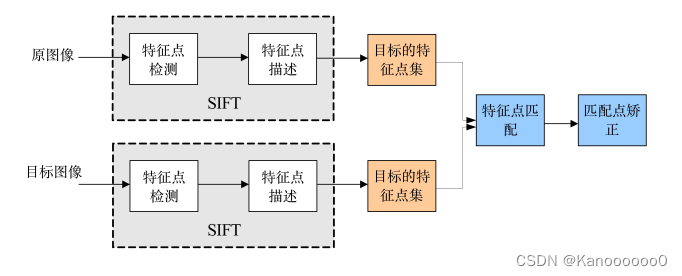
2.2 关键点检测的相关概念
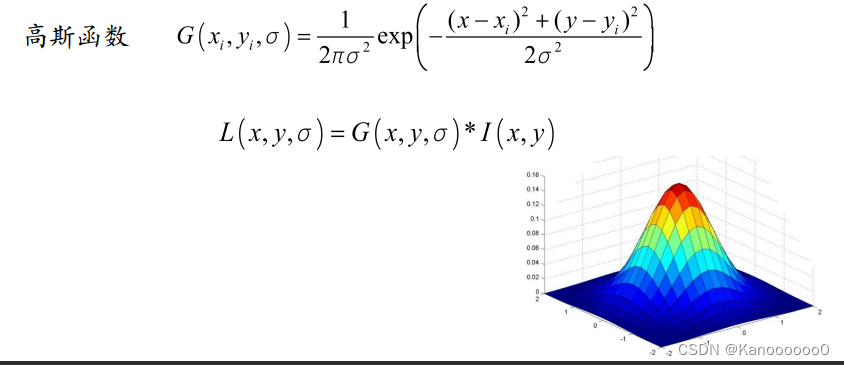
根据文献《Scale-space theory: A basic tool for analysing structures at different scales》可知,高斯核可以产生 多尺度空间的核,一个图像的 尺度空间,L(x, y, σ) ,定义为原始图像 I(x, y)与一个可变尺度的2维高斯 函数G(x, y, σ) 卷积运算。
2.3 SIFT算法特征的代码实现
import cv2 as cv
from cv2 import waitKey
import numpy as np
import matplotlib.pyplot as plt
if __name__ == '__main__':
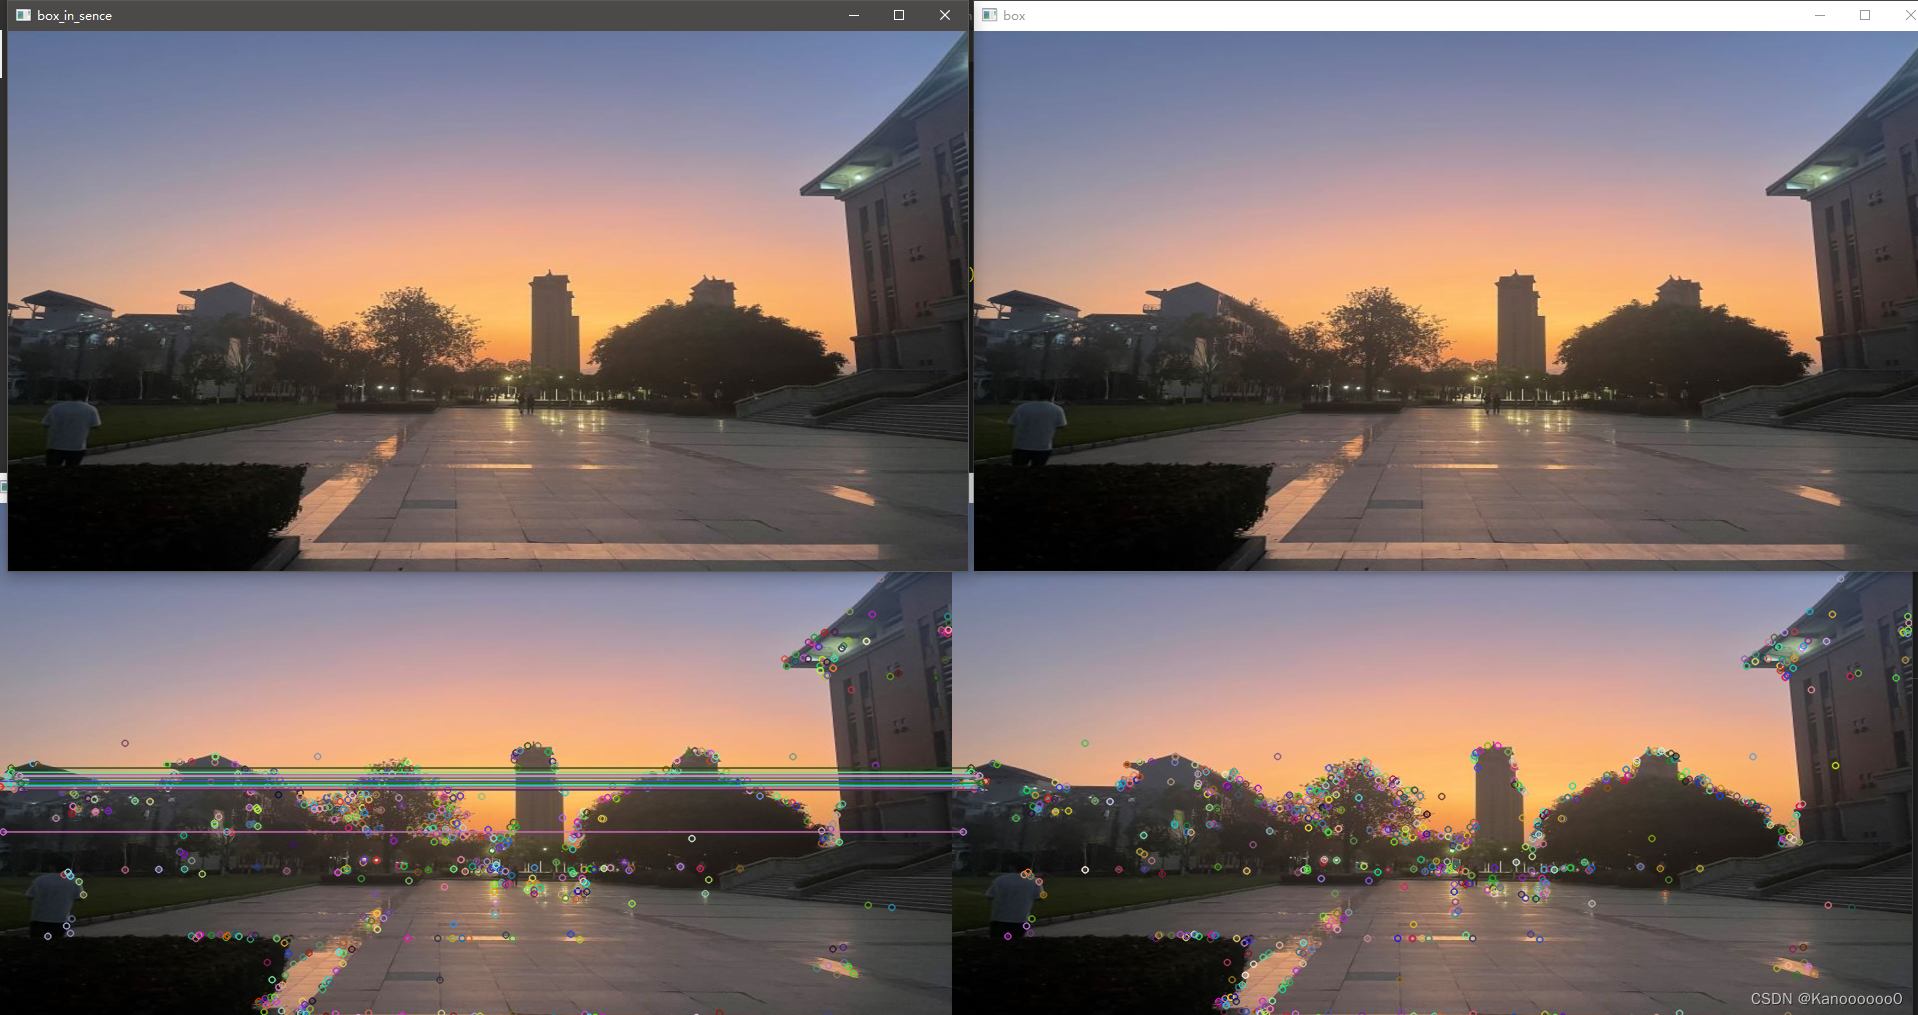
box = cv.imread("C:\\Users\\19835\\Desktop\\opencv\\task2\\task_1.jpg")
# 压缩图片以便显示
box=cv.resize(box,(960,540))
box_in_sence = cv.imread("C:\\Users\\19835\\Desktop\\opencv\\task2\\task_2.jpg")
box_in_sence=cv.resize(box_in_sence,(960,540))
cv.imshow("box", box)
cv.imshow("box_in_sence", box_in_sence)
# 创建SIFT特征检测器
sift = cv.SIFT_create()
# 特征点提取与描述子生成
kp1, des1 = sift.detectAndCompute(box,None)
kp2, des2 = sift.detectAndCompute(box_in_sence,None)
# 暴力匹配
bf = cv.DescriptorMatcher_create(cv.DescriptorMatcher_BRUTEFORCE)
matches = bf.match(des1,des2)
# 绘制最佳匹配
matches = sorted(matches, key = lambda x:x.distance)
result = cv.drawMatches(box, kp1, box_in_sence, kp2, matches[:15], None)
cv.imshow("-match", result)
cv.waitKey(0)
cv.destroyAllWindows()
2.4 SIFT匹配地理标记图像
from pylab import *
from PIL import Image
from PCV.localdescriptors import sift
from PCV.tools import imtools
import pydot

#download_path = "panoimages"  # set this to the path where you downloaded the panoramio images
#path = "/FULLPATH/panoimages/"  # path to save thumbnails (pydot needs the full system path)

download_path = "C:\\Users\\Kano\\Desktop\\Study\\computer vision\\Test2"  # set this to the path where you downloaded the panoramio images
path = "C:\\Users\\Kano\\Desktop\\Study\\computer vision\\Test2"  # path to save thumbnails (pydot needs the full system path)

# list of downloaded filenames
imlist = imtools.get_imlist(download_path)
nbr_images = len(imlist)

# extract features
featlist = [imname[:-3] + 'sift' for imname in imlist]
for i, imname in enumerate(imlist):
    sift.process_image(imname, featlist[i])

matchscores = zeros((nbr_images, nbr_images))

for i in range(nbr_images):
    for j in range(i, nbr_images):  # only compute upper triangle
        print ('comparing ', imlist[i], imlist[j])
        l1, d1 = sift.read_features_from_file(featlist[i])
        l2, d2 = sift.read_features_from_file(featlist[j])
        matches = sift.match_twosided(d1, d2)
        nbr_matches = sum(matches > 0)
        print ('number of matches = ', nbr_matches)
        matchscores[i, j] = nbr_matches
print ("The match scores is: \n", matchscores)

# copy values
for i in range(nbr_images):
    for j in range(i + 1, nbr_images):  # no need to copy diagonal
        matchscores[j, i] = matchscores[i, j]

#可视化

threshold = 2  # min number of matches needed to create link

g = pydot.Dot(graph_type='graph')  # don't want the default directed graph

for i in range(nbr_images):
    for j in range(i + 1, nbr_images):
        if matchscores[i, j] > threshold:
            # first image in pair
            im = Image.open(imlist[i])
            im.thumbnail((100, 100))
            filename = path + str(i) + '.png'
            im.save(filename)  # need temporary files of the right size
            g.add_node(pydot.Node(str(i), fontcolor='transparent', shape='rectangle', image=filename))

            # second image in pair
            im = Image.open(imlist[j])
            im.thumbnail((100, 100))
            filename = path + str(j) + '.png'
            im.save(filename)  # need temporary files of the right size
            g.add_node(pydot.Node(str(j), fontcolor='transparent', shape='rectangle', image=filename))

            g.add_edge(pydot.Edge(str(i), str(j)))
g.write_png('test.png')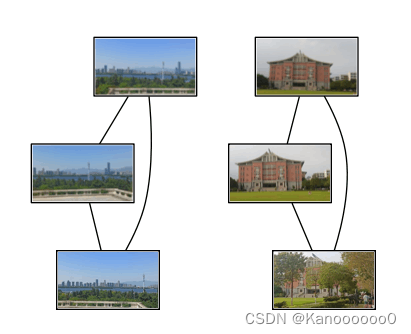


 1万+
1万+


 被折叠的 条评论
为什么被折叠?
被折叠的 条评论
为什么被折叠?
 到【灌水乐园】发言


