


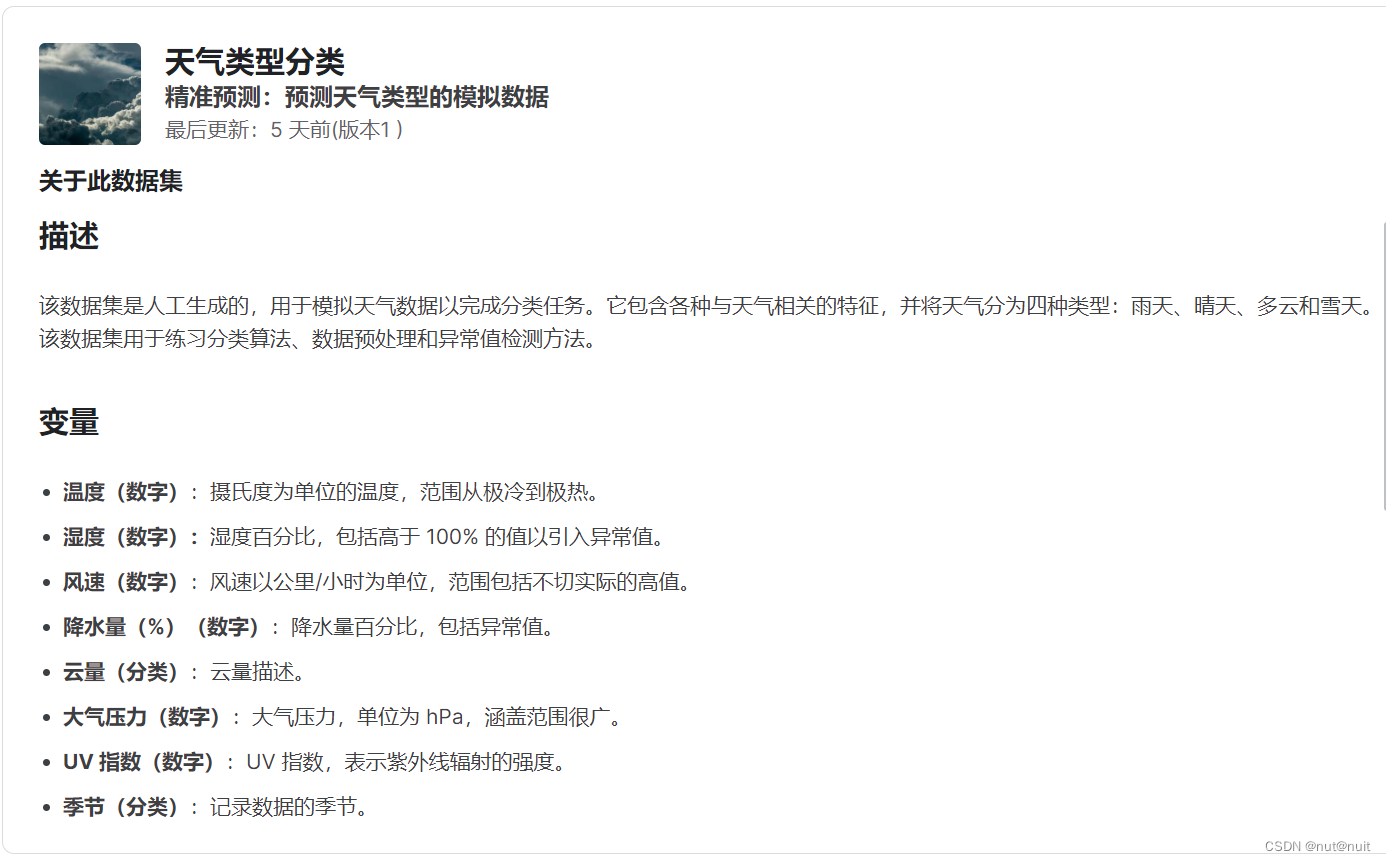
备考考研快累疯了,随便写点东西歇会,前阵子在kaggle看到一个比较简单的数据集,拿来实践一下。(希望各位大佬轻喷,给指点一二)
Weather Type Classification | Kaggle
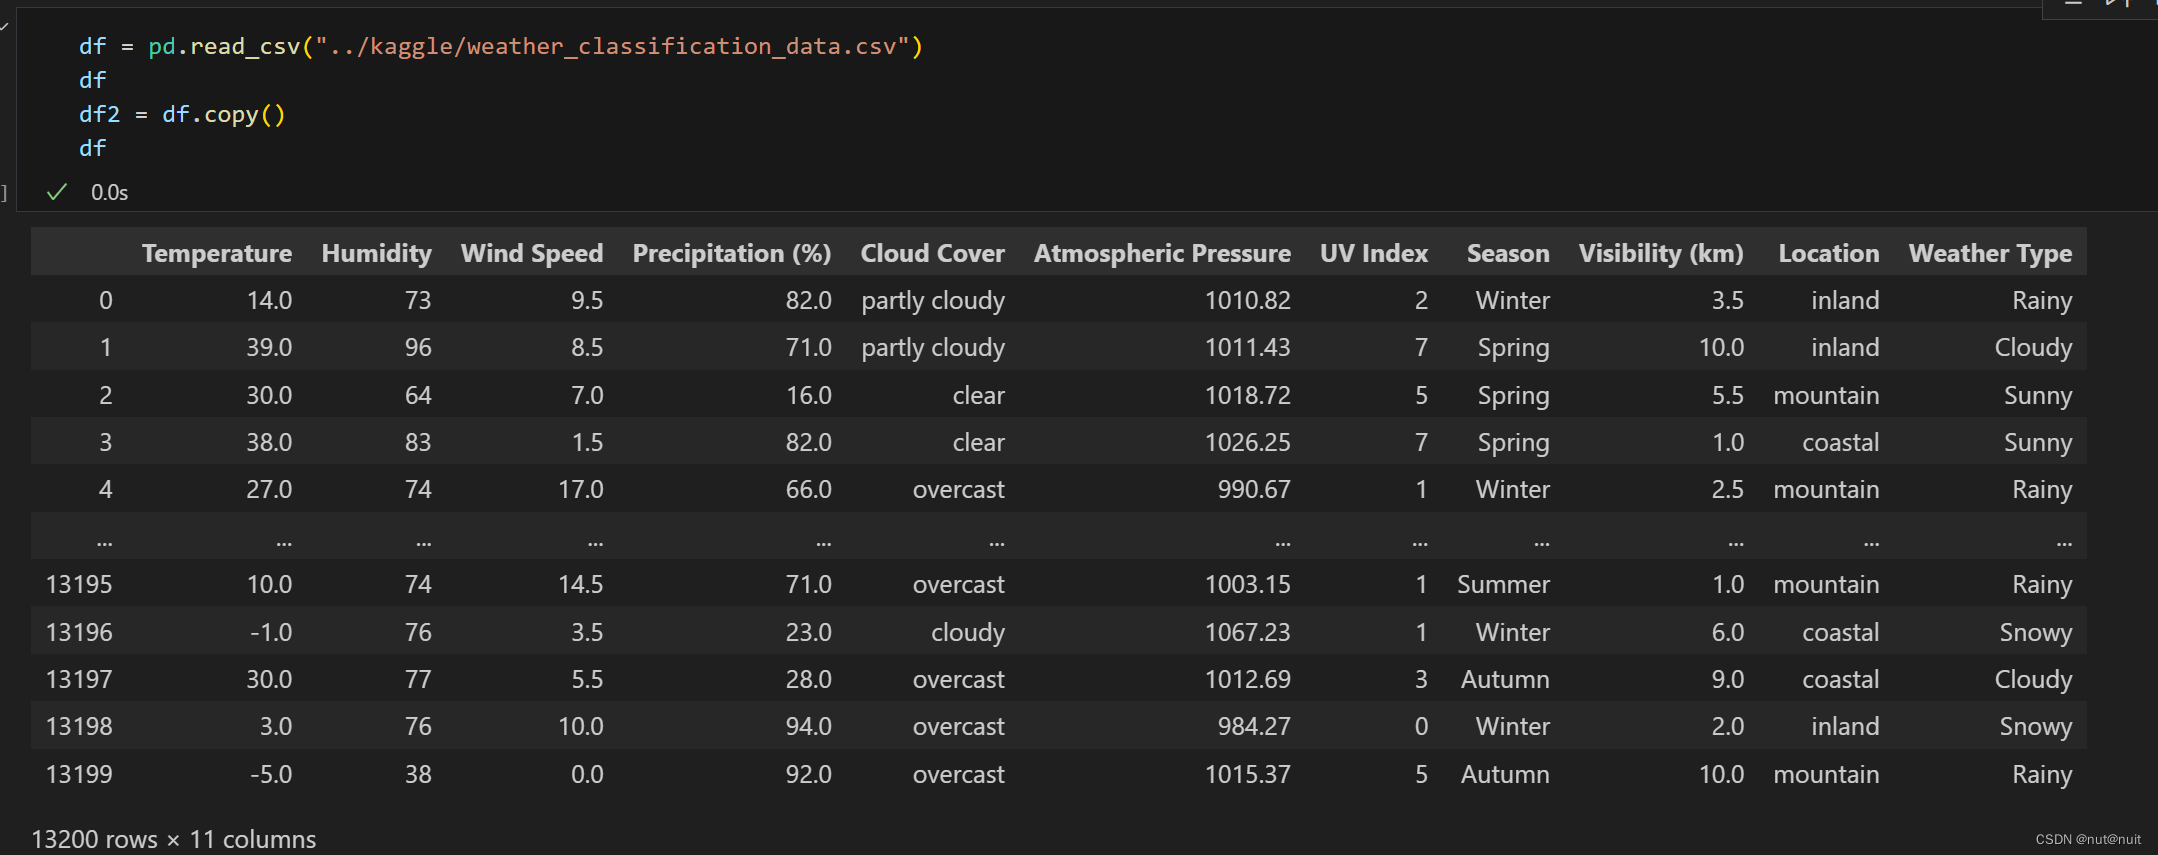
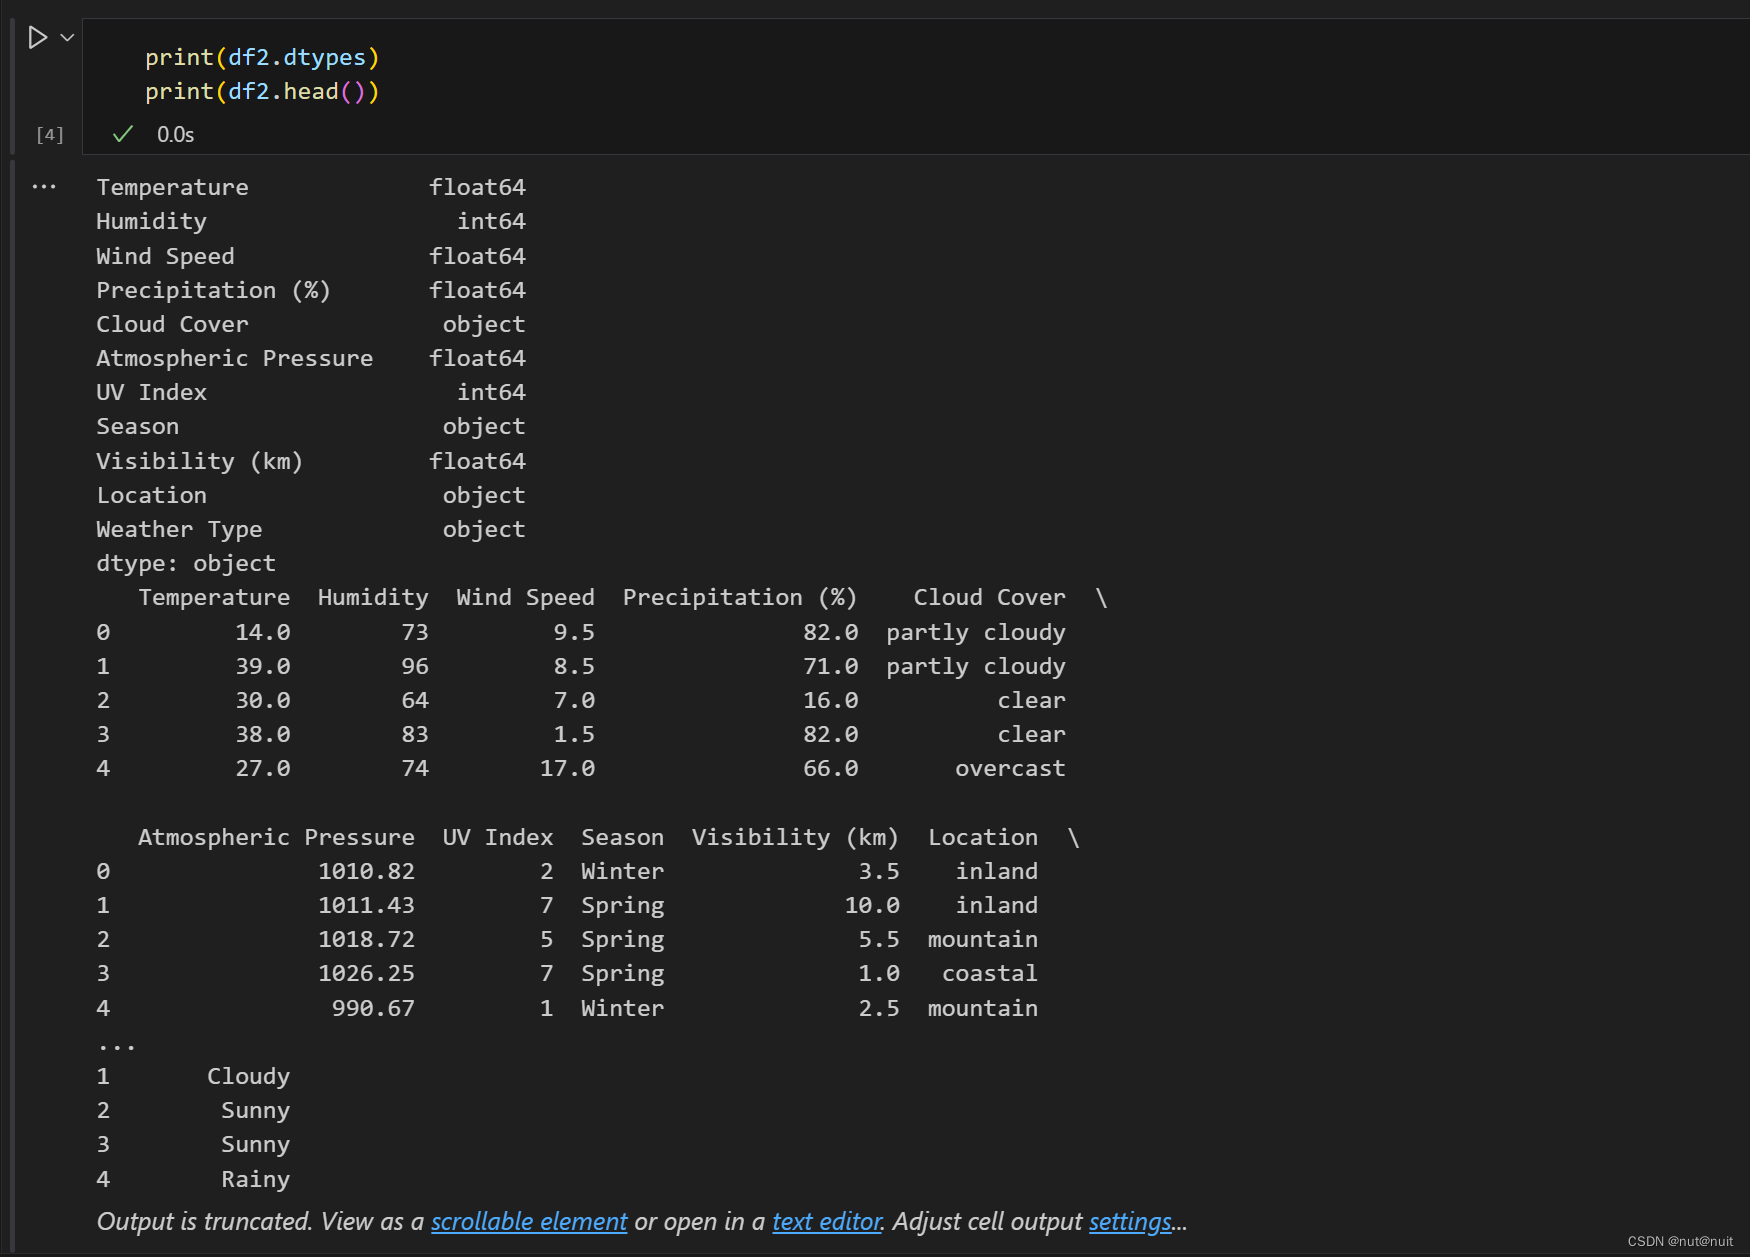
数据的基本情况如下:
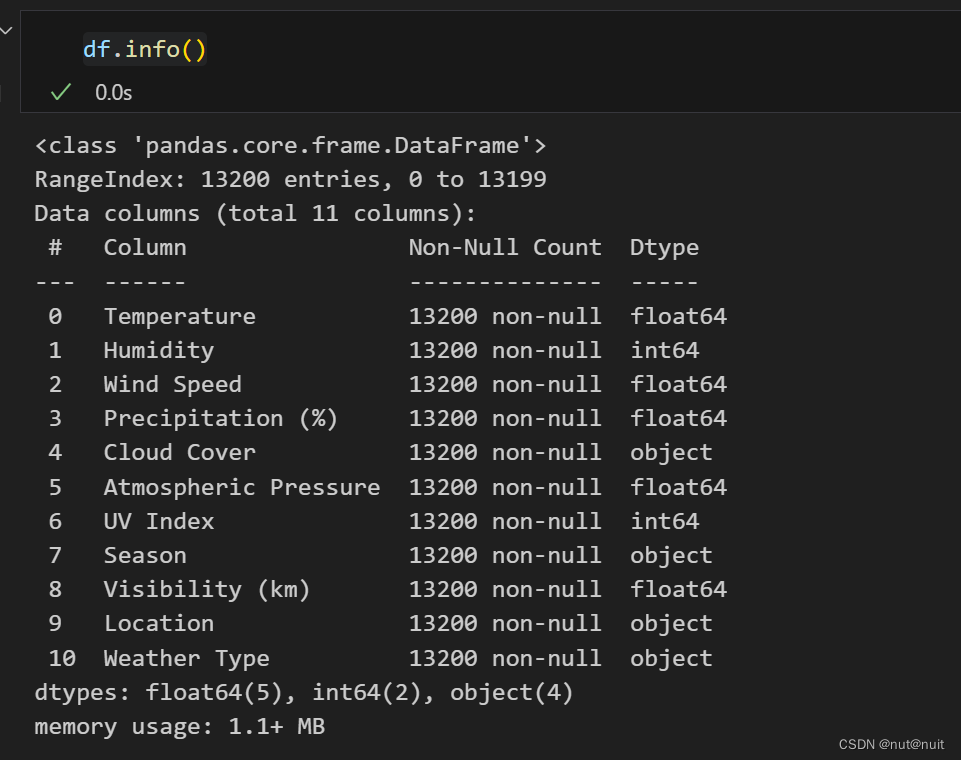
数据集没有缺失值和空值,所以跳过异常值处理的步骤,紧接着对字符型的离散数据进行特征编码的处理,这里有Cloud Cover, Season, Location和Weather Type 需要进行处理,在这里,云层覆盖情况和天气情况存在内在的连续性,所以决定采用Labelencodeing标签编码,其余两个特征选择独热编码,在这里Label用Sklearn 实现,onehot用pandas.get_dummies实现,毕竟他的结果直接是个DataFrame,好操作些。
CloudCover=pd.DataFrame( df['Cloud Cover'])     # 云层
Season = pd.DataFrame(df['Season'])             # 春 夏 秋 冬
Location=pd.DataFrame(df['Location'])           # 地点
Weather_Type =pd.DataFrame(df['Weather Type'])  # 天气类型
print(Location)
Location_B = pd.get_dummies(Location)
print(Season)
Season_B = pd.get_dummies(Season)
print(Weather_Type)
wt = LabelEncoder()
Weather_Type_A=wt.fit_transform(Weather_Type)
Weather_Type_B = pd.DataFrame(Weather_Type_A,columns=['Weather_Type'])
print(Weather_Type_B)
print(wt.transform(wt.classes_))
print(wt.classes_)
print(CloudCover)
cld = LabelEncoder()
CloudCover_A=cld.fit_transform(CloudCover)
CloudCover_B = pd.DataFrame(CloudCover_A,columns=['CloudCover'])
print(CloudCover_B)

df3 = pd.concat([df2,CloudCover_B],axis=1)
df4 = pd.concat([df3,Season_B],axis=1)
df5 = pd.concat([df4,Location_B],axis=1)
df6 = pd.concat([df5,Weather_Type_B],axis=1)
df7 = df6.copy()
df7=df7.drop(["Cloud Cover","Season","Location","Weather Type"],axis=1)
后面pd.concat可以写个循环嵌套一下,不用写得那么冗杂,这里就不改了。
接下来做些数据可视化
plt.figure(figsize=(12,8))
sns.countplot(x='Cloud Cover',hue='Weather Type',data=df,palette='Set3')
plt.title('CloudCover-WeatherType',fontsize=20)
plt.show()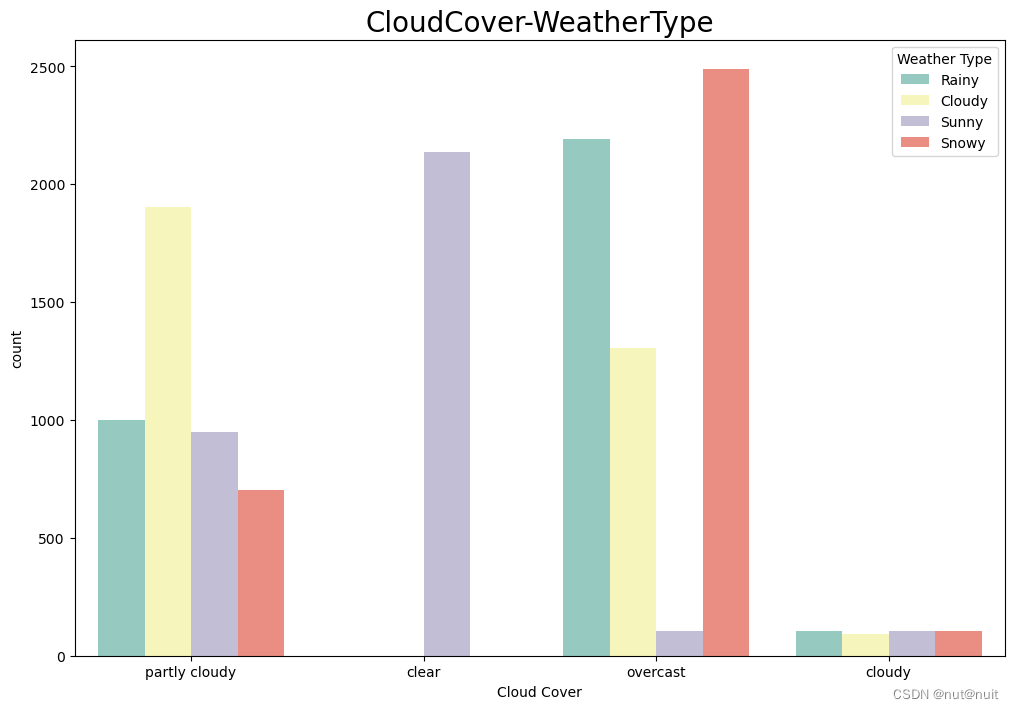
plt.figure(figsize=(12,8))
sns.countplot(x='Season',hue='Weather Type',data=df,palette='Set3')
plt.title('Season-WeatherType',fontsize=20)
plt.show()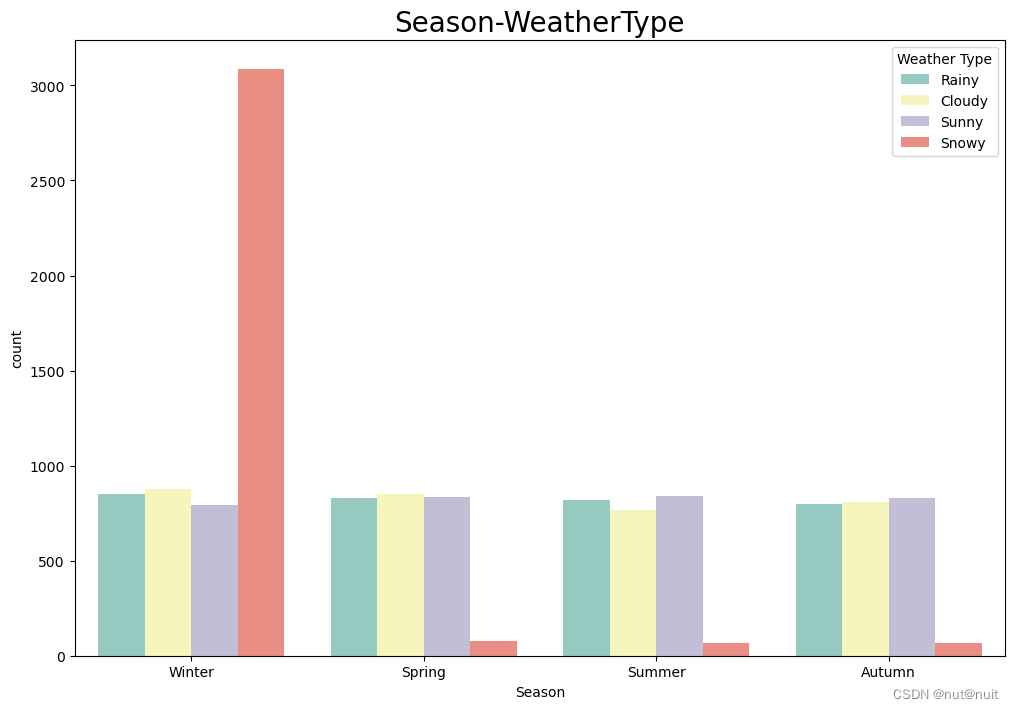
plt.figure(figsize=(12,8))
sns.countplot(x='Location',hue='Weather Type',data=df,palette='Set3')
plt.title('Location-WeatherType',fontsize=20)
plt.show()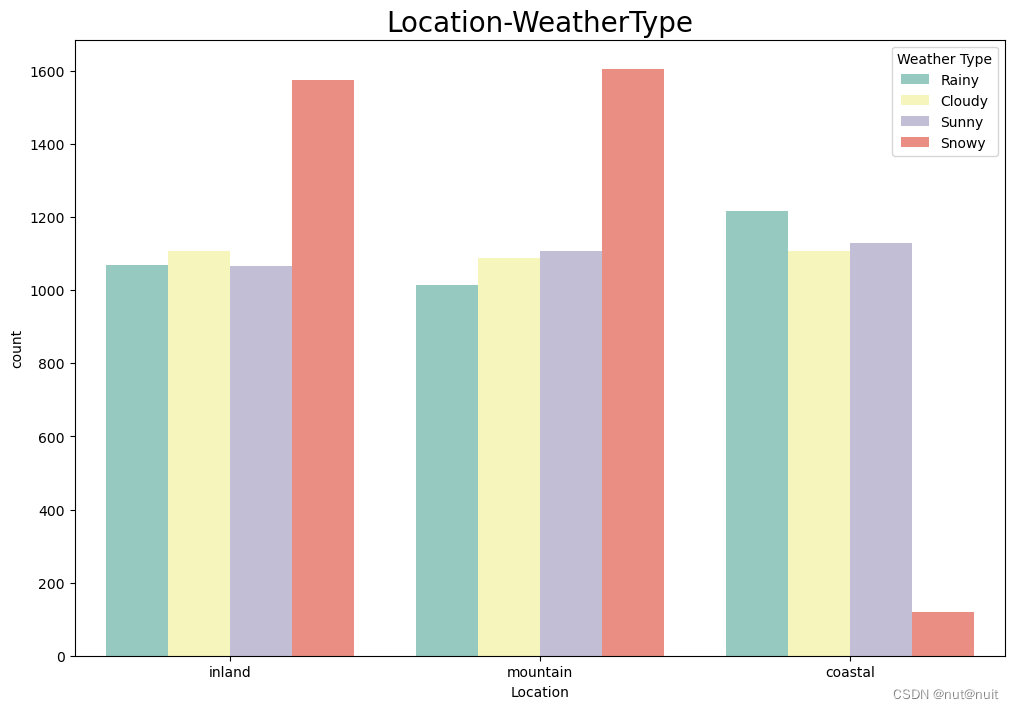
sns.pairplot(df[df.columns.tolist()[:]])
plt.figure(figsize=(19,19))
plt.imshow(df7.iloc[:,:].corr(),cmap='Blues')
plt.xticks(range(len(df7.iloc[:,:].corr().columns.tolist())),df7.iloc[:,:].corr().columns.tolist(),rotation=45)
plt.yticks(range(len(df7.iloc[:,:].corr().columns.tolist())),df7.iloc[:,:].corr().columns.tolist(),rotation=45)
plt.colorbar()
plt.show()
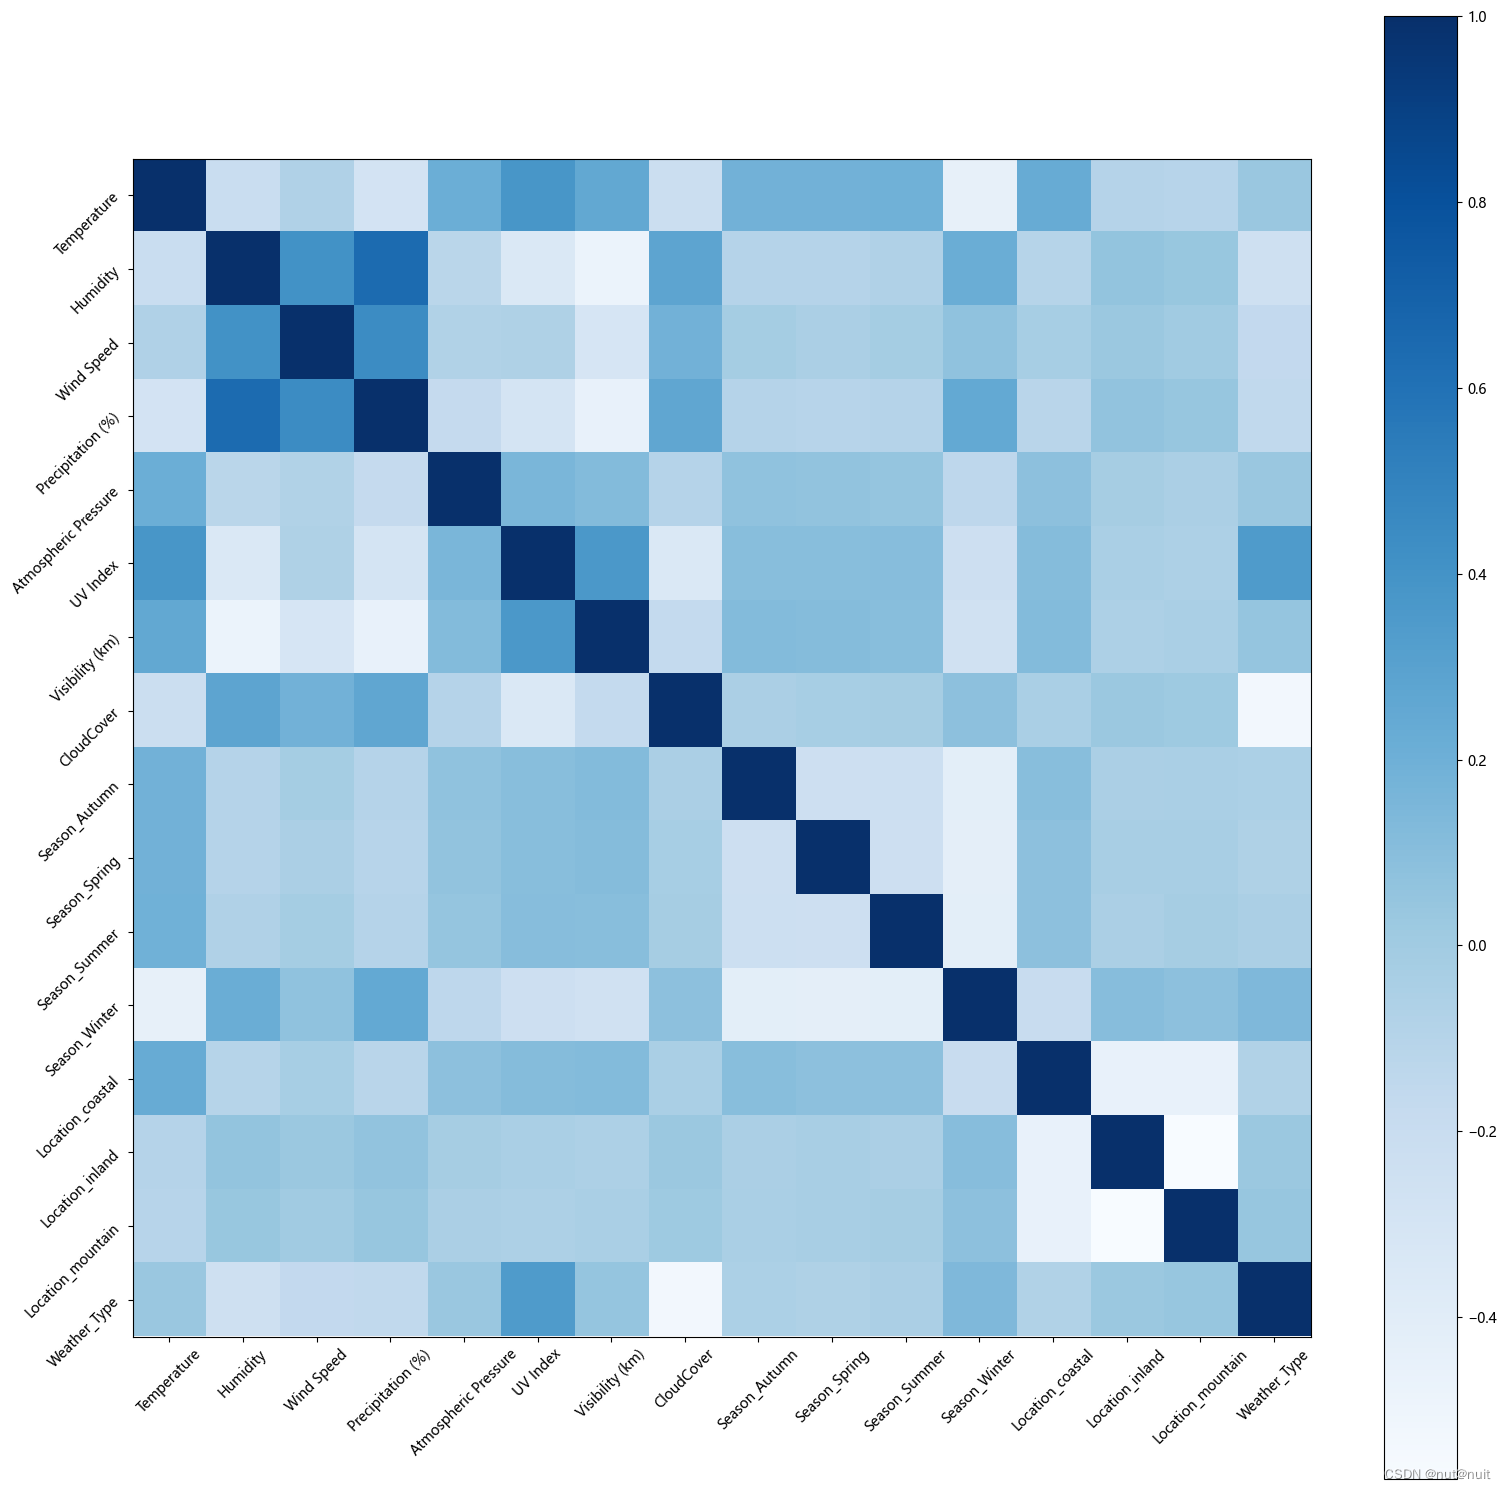 新建一个列表,存放一些相关性绝对值小于0.1的的特征,并在数据框内进行删除
drop_list=[]
for i in range(len(df7.iloc[:,:].corr()['Weather_Type'])):
    print(abs(df7.iloc[:,:].corr()['Weather_Type'][i]))
    if(abs(df7.iloc[:,:].corr()['Weather_Type'][i])<0.1):
        drop_list.append(df7.columns[i])
调用xgboost进行模型的训练,训练集和测试集按3:7进行划分,并对模型结果进行评估。
X_train, X_test, y_train, y_test = train_test_split(X, y, test_size=0.3, train_size=0.7, random_state=42)
model2 = xgboost.XGBClassifier()
model2.fit(X_train, y_train)
y_pred = model2.predict(X_test)
cm = confusion_matrix(y_test, y_pred)
label_mapping = {0:'Cloudy',1:'Rainy',2:'Snowy',3:'Sunny'}
# 输出混淆矩阵
for i, true_label in enumerate(label_mapping):
    row = ''
    for j, pred_label in enumerate(label_mapping.values()):
        row += f'{cm[i, j]} ({pred_label})\t'
    print(f'{row} | {true_label}')


print(classification_report(y_test, y_pred,target_names=['Cloudy','Rainy','Snowy','Sunny']))  # 输出混淆矩阵
print("Accuracy:")
print(accuracy_score(y_test, y_pred))
模型训练的结果如下:
819 (Cloudy)	58 (Rainy)	38 (Snowy)	40 (Sunny)	 | 0
60 (Cloudy)	763 (Rainy)	140 (Snowy)	19 (Sunny)	 | 1
38 (Cloudy)	51 (Rainy)	926 (Snowy)	18 (Sunny)	 | 2
45 (Cloudy)	30 (Rainy)	32 (Snowy)	883 (Sunny)	 | 3
              precision    recall  f1-score   support

      Cloudy       0.85      0.86      0.85       955
       Rainy       0.85      0.78      0.81       982
       Snowy       0.82      0.90      0.85      1033
       Sunny       0.92      0.89      0.91       990

    accuracy                           0.86      3960
   macro avg       0.86      0.86      0.86      3960
weighted avg       0.86      0.86      0.86      3960
Accuracy:
0.8563131313131314根据报告,模型在所有类别上的精确度、召回率和F1分数都相对较高,表明模型的整体性能是不错的。模型的总体准确率为 86%。


 555
555

 被折叠的 条评论
为什么被折叠?
被折叠的 条评论
为什么被折叠?
 到【灌水乐园】发言


