


基本使用
在文本textStyle和axisLabel的rich中可以使用富文本,写入富文本的类名。
富文本类名可以在formatter中使用。 formatter:"{类名|{value}}"
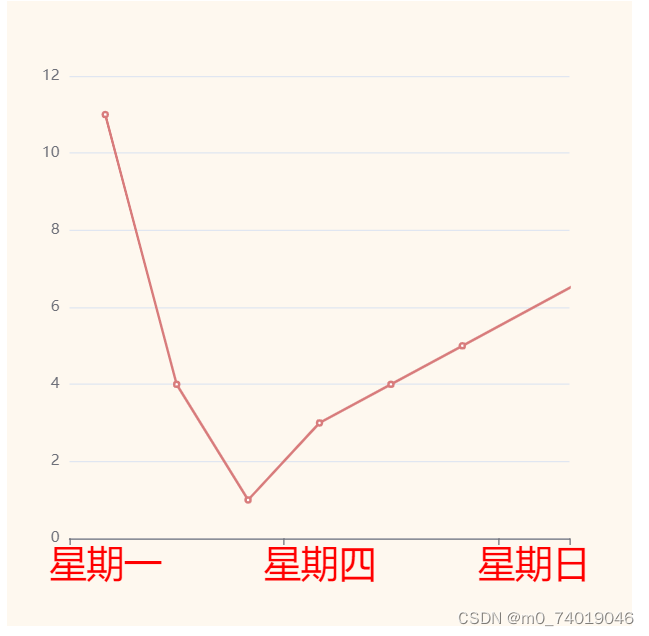
在axisLabel的rich中使用
  const d1 = [[0, 11], [1, 4], [2, 1], [3, 3], 4, 5, 7];
  let options = {
    xAxis: {
      type: "category",
      data: [
        "星期一",
        "星期二",
        "星期三",
        "星期四",
        "星期五",
        "星期六",
        "星期日",
      ],
      axisLabel: {
        rich: {
          labelClass: {
            color: "red",
            fontSize: 25,
          },
        },
        formatter: (value) => {
          return `{labelClass|${value}}`;
        },
      },
    },
    yAxis: {},
    series: [
      {
        name: "d1",
        type: "line",
        data: d1,
      },
    ],
  };
在textStyle的rich中使用
 const d1 = [[0, 11], [1, 4], [2, 1], [3, 3], 4, 5, 7];
  let options = {
    xAxis: {
      type: "category",
      data: [
        "星期一",
        "星期二",
        "星期三",
        "星期四",
        "星期五",
        "星期六",
        "星期日",
      ],
    },
    legend: {
      show: true,
      textStyle: {
        rich: {  // rich支持多个class:{类名|xxx}
          textClass: {
            color: "blue",
          },
          bgClass: {
            width: 10,
            height: 10,
            backgroundColor: "yellow",
          },
          imgClass: {
            width: 20,
            height: 20,
            backgroundColor: {
              image: "http://localhost:5173/favicon.ico",
            },
          },
        },
      },
      formatter: (value) => {
        console.log(value);
        return `{bgClass|}{textClass|${value}}{imgClass|}`;
      },
    },
    yAxis: {},
    series: [
      {
        name: "d1",
        type: "line",
        data: d1,
      },
    ],
  };

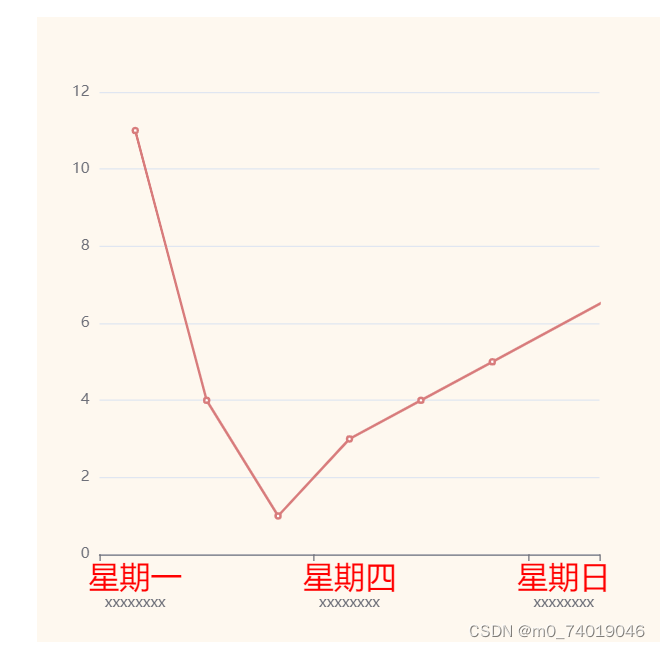
如果要换行的话可以使用\n
let options = {
    xAxis: {
      type: "category",
      data: [
        "星期一",
        "星期二",
        "星期三",
        "星期四",
        "星期五",
        "星期六",
        "星期日",
      ],
      axisLabel: {
        rich: {
          labelClass: {
            color: "red",
            fontSize: 25,
          },
        },
        formatter: (value) => {
          return `{labelClass|${value}}\nxxxxxxxx`;
        },
      },
    },
    yAxis: {},
    series: [
      {
        name: "d1",
        type: "line",
        data: d1,
      },
    ],
  };
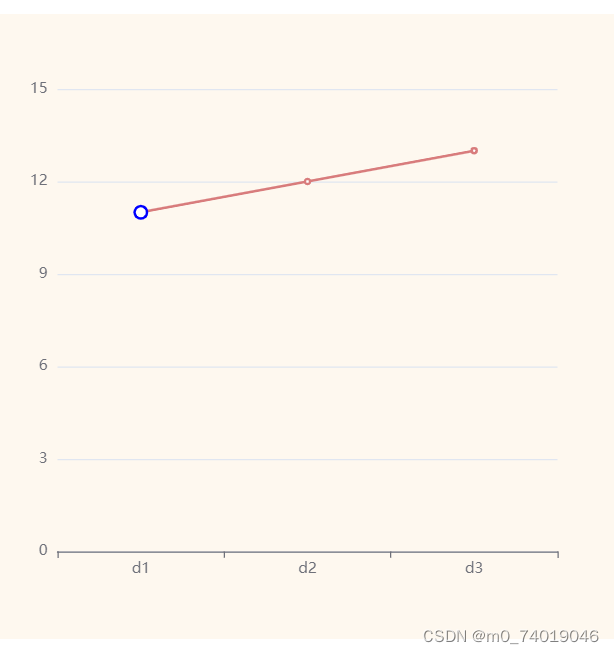
data的对象形式
data数组里面可以写一个数组,数字,也可以写一个对象。写成对象后只能按默认的顺序和类目中的数据对应,但是可以单独修改某一个数据的样式。
 let options = {
    xAxis: {
      type: "category",
      data: ["d1", "d2", "d3"],
    },
    yAxis: {},
    series: [
      {
        name: "d1",
        type: "line",
        data: [
          {
            value: 11,
            name: "b",
            symbolSize: 10,
            itemStyle: {
              color: "blue",
            },
          },
          {
            value: 12,
            name: "a",
          },
          {
            value: 13,
            name: "c",
          },
        ],
      },
    ],
  };


 2537
2537


 被折叠的 条评论
为什么被折叠?
被折叠的 条评论
为什么被折叠?
 到【灌水乐园】发言


