


图形填充颜色
多边形的颜色填充就是将封闭区域用指定颜色进行覆盖,从而实现不同几何图形的彩色展示。 下面,我们分别从规则多边形和不规则多边形两个方面讲解实现多边形颜色填充的方法。
一,规则多边形颜色填充
规则多边形主要指矩形、菱形、圆形等几何图形。这些图形的颜色填充主要是借助有序数对形 成封闭式的几何路径实现的。
(1)代码示例
import matplotlib.pyplot as plt
import numpy as np

x = [0, 0, 5, 10, 15, 15, 10, 5]
y = [5, 10, 15, 15, 10, 5, 0, 0]

plt.fill(x, y, color="cornflowerblue")

plt.xlim(-1, 16)
plt.ylim(-1, 16)

plt.xticks(np.arange(0, 16, 5))
plt.yticks(np.arange(0, 16, 5))

plt.show()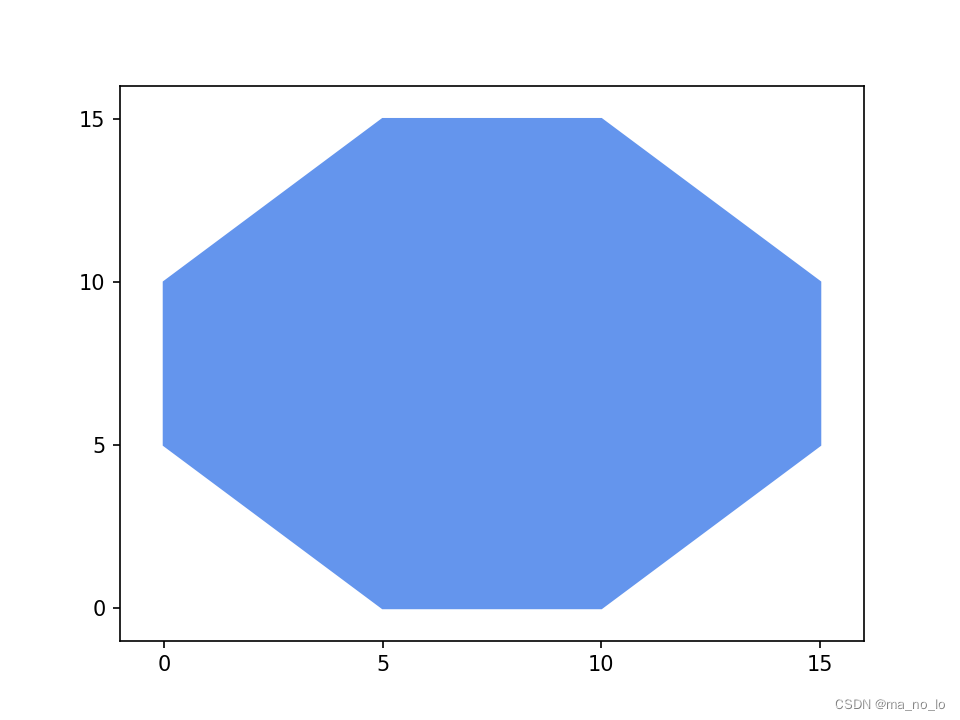
(2)代码解释
<1>通过调用函数 fill()来完成绘制八边形的任务,参数 x 和 y 是用来绘制封闭区域的顶点的有序数对,参数 color 用来完成封闭区域的填充颜色的设置工作。
<2>为了使可视化效果更加理想,我们使用函数 xlim()和 ylim()完成多边形相对位置的调整。
<3>使用函数 xticks()和 yticks()调整刻度线的显示位置,从而清楚地显示出封闭区域的顶点位置。
<4>调用函数 show()展示规则多边形的绘制效果。
二,不规则多边形颜色填充
不规则多边形主要是由图形围成的封闭区域。因此,不规则多边形的颜色填充就是将图形围成 的封闭区域用颜色进行覆盖。
(1)代码示例
import matplotlib.pyplot as plt
import numpy as np

x = np.linspace(0,2*np.pi,500)
y = np.sin(x)

plt.fill(x,y,color="cornflowerblue",alpha=0.4)

plt.plot(x,y,color="cornflowerblue",alpha=0.8)
plt.plot([x[0],x[-1]],[y[0],y[-1]],color="cornflowerblue",alpha=0.8)

plt.xlim(0,2*np.pi)
plt.ylim(-1.1,1.1)

plt.show() 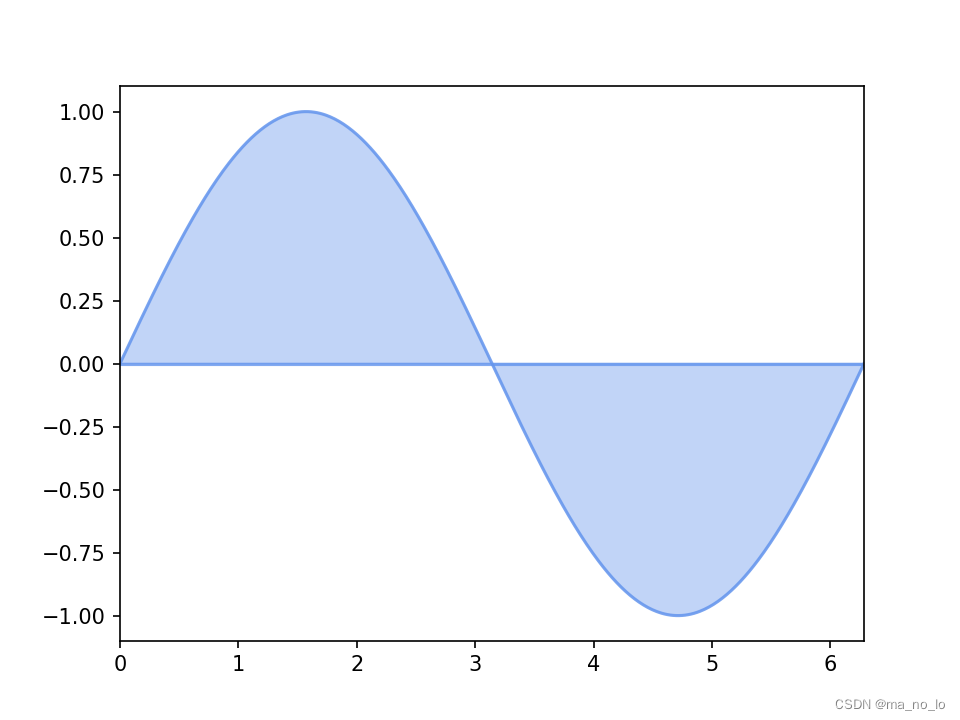
(2)代码解释
<1>通过调用函数 fill(),可以将由正弦曲线围成的封闭区域用颜色填充,从而形成不规则多边 形的填充区域。
<2>借助折线函数 plot()给填充区域添加区域轮廓。同时,使用参数 alpha 可以分别设置填充区 域的颜色透明度和图形颜色的透明度,从而产生填充区域和区域轮廓的颜色深浅变化。
三,交叉曲线颜色填充
在有由多条曲线围成的公共区域的情形下,我们需要用颜色去填充这些公共区域,这就需要 使用交叉曲线的颜色填充方法。
(1)代码示例
import matplotlib.pyplot as plt
import numpy as np

x = np.linspace(0,2,500)
y1 = np.sin(2*np.pi*x)
y2 = 1.1*np.sin(3*np.pi*x)

fig,ax = plt.subplots(3,1,sharex="all")

# "between y2 and 0"
ax[0].fill_between(x,0,y2,alpha=0.5)
ax[0].set_ylim(-1.2,1.2)

# "between y2 and 1.1"
ax[1].fill_between(x,y2,1.1,alpha=0.5)
ax[1].set_ylim(-1.2,1.2)

# "between y1 and y2"
ax[2].fill_between(x,y1,y2,alpha=0.5)
ax[2].set_xlim(0,2)
ax[2].set_ylim(-1.2,1.2)

plt.show() 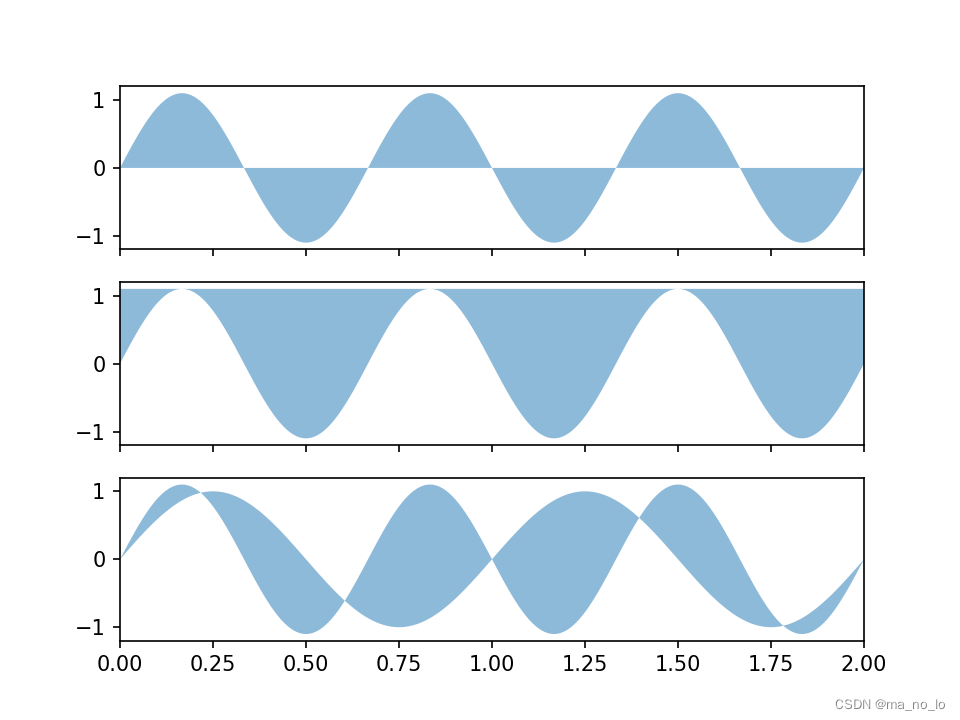
(2)代码解释
<1>通过调用“plt.subplots(3,1,sharex="all")”语句,可以获得一个画布对象 fig 和一个坐标轴列 表 ax。这是一个 3 行 1 列的共享 x 轴的网格布局的子区。
<2>在子区 1 中,调用实例方法 fill_between()填充由曲线 y2 和曲线 y=0 交叉围成的公共区域的 颜色,同时,使用参数 alpha 调整填充区域的透明度。 (3>在子区 2 中,调用实例方法 fill_between()填充由曲线 y2 和曲线 y=1.1 交叉围成的公共区域 的颜色,以及调整填充区域的颜色饱和度。 (4)在子区 3 中,需要填充由曲线 y1 和曲线 y2 交叉围成的公共区域的颜色,同样,借助参数 alpha 实现合适的填充颜色的透明度。
四,水平方向的交叉曲线的颜色填充方法
我们不仅可以填充由若干条曲线围成的公共区域的颜色,还可以按照一定的条件表达式来选择 性地填充公共区域的颜色。因此,我们需要借助实例方法 fill_between()和 fill_betweenx()的参数 where 来实现满足具体条件的指定区域的颜色填充的目标。接下来,我们就通过具体的代码和精讲来详细 地阐述其实现方法。
(1)代码示例
import matplotlib.pyplot as plt
import numpy as np

x = np.linspace(0,2,500)
y1 = np.sin(2*np.pi*x)
y2 = 1.1*np.sin(3*np.pi*x)

fig = plt.figure()

ax = fig.add_subplot(111)

# plot y1 and plot y2
ax.plot(x,y1,color="k",lw=1,ls="-")
ax.plot(x,y2,color="k",lw=1,ls="-")

# "where y1 <= y2"
ax.fill_between(x,y1,y2,where=y2>=y1,interpolate=True,
 facecolor="cornflowerblue",alpha=0.7)

# where y1>= y2
ax.fill_between(x,y1,y2,where=y2<=y1,interpolate=True,
 facecolor="darkred",alpha=0.7)

ax.set_xlim(0,2)
ax.set_ylim(-1.2,1.2)

ax.grid(ls=":",lw=1,color="gray",alpha=0.5)

plt.show() 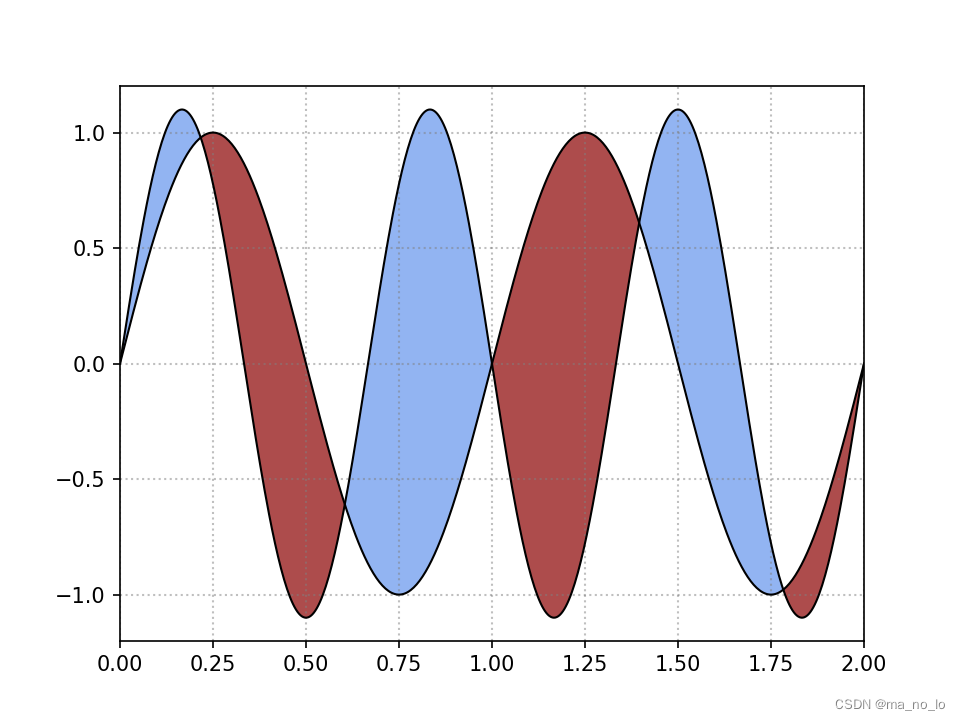
(2)代码解释
<1>调用实例方法 fill_between(),通过使用参数 where 的条件表达式参数值,实现满足具体条 件的指定区域的颜色填充的目标。
<2>具体而言,如果曲线 y1 的取值不小于曲线 y2 的取值,那么将这部分公共区域的颜色用 “darkred”填充;如果曲线 y2 的取值不小于曲线 y1 的取值,那么将这部分公共区域的填充颜色设 置为“cornflowerblue”。同时,借助参数 interpolate 的取值是“True”,可以将曲线交叉点附近的公 共区域用指定颜色进行填充。使用参数 alpha 进行填充区域的透明度的设置。
<3>调用实例方法 plot()绘制填充区域的轮廓曲线,从而清晰地标记出不同填充区域的颜色内容。
五,垂直方向的交叉曲线的颜色填充方法
我们主要借助实例方法 fill_betweenx()来实现垂直方向的交叉曲线的颜色填充的目标。下面,我 们就详细介绍实例方法 fill_betweenx()的操作细节。
(1)代码示例
import matplotlib.pyplot as plt
import numpy as np

y = np.linspace(0,2,500)
x1 = np.sin(2*np.pi*y)
x2 = 1.1*np.sin(3*np.pi*y)

fig = plt.figure()

ax = fig.add_subplot(111)

# plot x1 and plot x2
ax.plot(x1,y,color="k",lw=1,ls="-")
ax.plot(x2,y,color="k",lw=1,ls="-")

# "where x1 <= x2"
ax.fill_betweenx(y,x1,x2,where=x2>=x1,facecolor="cornflowerblue",alpha=0.7)

# where x1>= x2
ax.fill_betweenx(y,x1,x2,where=x2<=x1,facecolor="darkred",alpha=0.7)

ax.set_xlim(-1.2,1.2)
ax.set_ylim(0,2)

ax.grid(ls=":",lw=1,color="gray",alpha=0.5)


plt.show() 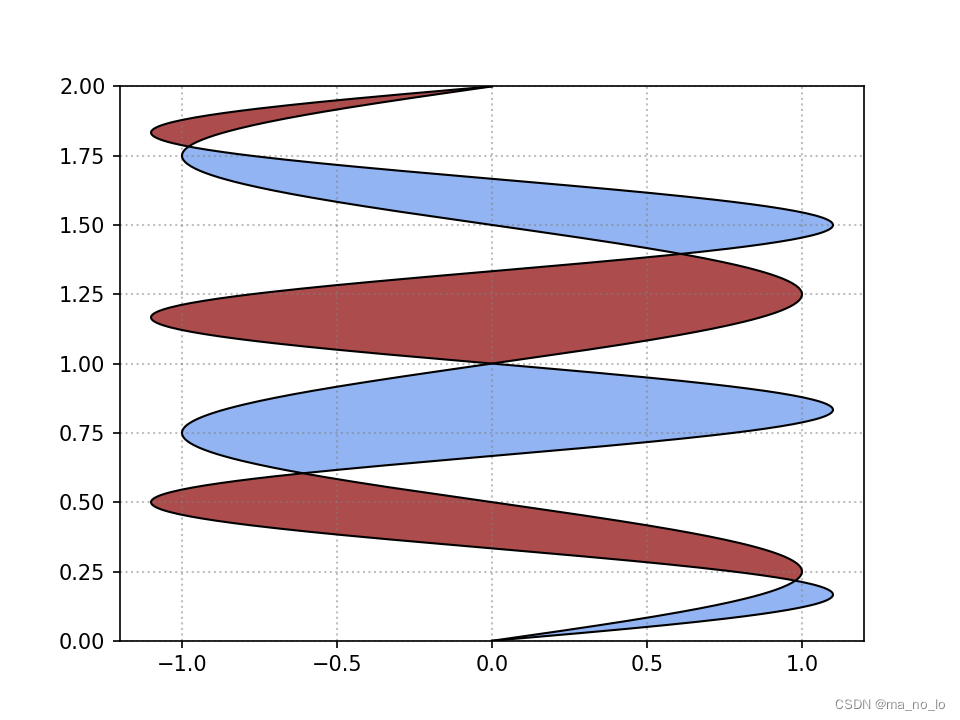
(2)代码解释
<1>使用实例方法 fill_betweenx()绘制垂直方向的交叉曲线的颜色填充区域。同样,借助参数 where 实现满足具体条件的指定区域的颜色填充的目标。以“ax.fill_betweenx(y,x1,x2,where=x2>=x1, facecolor="cornflowerblue",alpha=0.7)”语句为例,参数 y 表示 y 轴上的数值,参数 x1 和 x2 表示 x 轴上的数值,通过使用条件表达式“x2>=x1”实现满足具体条件的指定区域的颜色填充的目标,填 充颜色设定为“cornflowerblue”,使用参数 alpha 设定填充区域的透明度。
<2>实例方法 plot()的参数也进行 x 轴和 y 轴的数值位置的调整,即原来 y 轴上的数值现在放在 x 轴上,原来 x 轴上的数值现在放在 y 轴上,调用语句分别是“ax.plot(x1,y,color="k",lw=1,ls="-")” 和“ax.plot(x2,y,color="k",lw=1,ls="-")”。
六,综合案例
import matplotlib.pyplot as plt
import numpy as np

fig, ax = plt.subplots(1, 2)

# subplot(121) data
x = np.linspace(0, 2, 500)
y1 = np.sin(2 * np.pi * x)
y2 = 1.2 * np.sin(3 * np.pi * x)

y2 = np.ma.masked_greater(y2, 1.0)

# plot y1 and plot y2
ax[0].plot(x, y1, color="k", lw=1, ls="-")
ax[0].plot(x, y2, color="k", lw=1, ls="-")

# "where y1 <= y2"
ax[0].fill_between(x, y1, y2, where=y2 >= y1, facecolor="cornflowerblue", alpha=0.7)

# where y1>= y2
ax[0].fill_between(x, y1, y2, where=y2 <= y1, facecolor="darkred", alpha=0.7)

ax[0].set_xlim(0, 2)
ax[0].set_ylim(-1.2, 1.2)

ax[0].grid(ls=":", lw=1, color="gray", alpha=0.5)

# subplot(122) data
y = np.linspace(0, 2, 500)
x1 = np.sin(2 * np.pi * y)
x2 = 1.2 * np.sin(3 * np.pi * y)

x2 = np.ma.masked_greater(x2, 1.0)

# plot x1 and plot x2
ax[1].plot(x1, y, color="k", lw=1, ls="-")
ax[1].plot(x2, y, color="k", lw=1, ls="-")

# "where x1 <= x2"
ax[1].fill_betweenx(y, x1, x2, where=x2 >= x1, facecolor="cornflowerblue",
                    alpha=0.7)

# where x1>= x2
ax[1].fill_betweenx(y, x1, x2, where=x2 <= x1, facecolor="darkred", alpha=0.7)

ax[1].set_xlim(-1.2, 1.2)
ax[1].set_ylim(0, 2)

ax[1].grid(ls=":", lw=1, color="gray", alpha=0.5)

plt.show()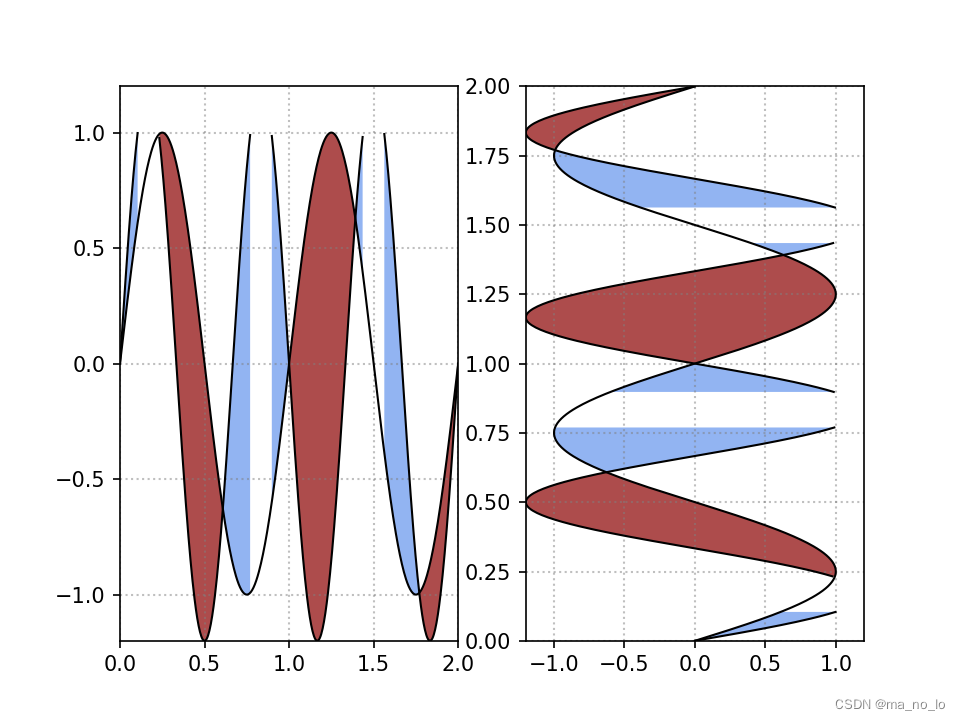


 1500
1500

 被折叠的 条评论
为什么被折叠?
被折叠的 条评论
为什么被折叠?
 到【灌水乐园】发言


