练习部分解释:跟网上大多数博客都不一样,因为之前我已经在notebook上做完了,再总结一遍放在博客上。
Class 1:神经网络和深度学习
Week 2:神经网络基础编程练习
目录
1、关于sigmoid的用法
- sigmoid、sigmoid积分、reshape、normalize归一化数据、softmax
import numpy as np

# 1、sigmoid函数
def sigmoid(x):
    s = 1.0/(1 + 1/np.exp(x))
    return s

# 2、梯度(积分)
def sigmoid_derivative(x):
    s = 1.0/(1 + 1/np.exp(x))
    ds = s*(1-s)
    return ds

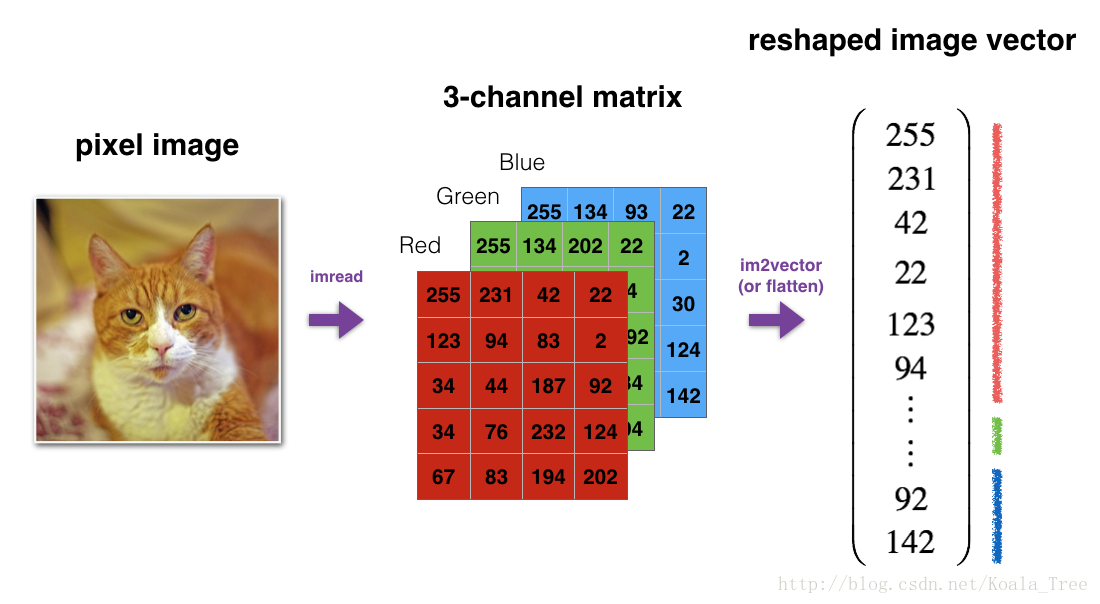
# 3、reshape (length,height,3) to (length*height*3,1)
def image2vector(image):
    v = image.reshape(image.shape[0]*image.shape[1]*image.shape[2],1)
    return v

# 4、normalize rows 归一化数据
#    归一化后,梯度下降收敛的更快
def normalizeRows(x):
    x_norm = np.linalg.norm(x,axis=1,keepdims = True) # 计算每一行的长度,得到一个列向
    x = x/x_norm
    return x

# 5、softmax
def softmax(x):
    x_exp = np.exp(x)  #(n,m)
    x_sum = np.sum(x_exp,axis=1,keepdims=True)  #(n,1)
    s = x_exp/x_sum    #(n,m)
    return s

if __name__=="__main__":
    x = np.array([1,2,3])
    print(sigmoid(x))
    print(sigmoid_derivative(x))

    image = np.array([[[0.6,0.3],[0.9,0.5],[0.4,0.3]],
                      [[0.9,0.2],[0.6,0.8],[0.7,0.1]],
                      [[0.3,0.4],[0.6,0.7],[0.9,0.9]]])
    print(image2vector(image))

    x = np.array([[0,3,4],[1,6,4]])
    print(normalizeRows(x))

    x = np.array([[9,2,5,0,0],[7,5,0,0,0]])
    print(softmax(x))
[ 0.73105858 0.88079708 0.95257413]
[ 0.19661193 0.10499359 0.04517666]
[[ 0.6]
[ 0.3]
[ 0.9]
[ 0.5]
[ 0.4]
[ 0.3]
[ 0.9]
[ 0.2]
[ 0.6]
[ 0.8]
[ 0.7]
[ 0.1]
[ 0.3]
[ 0.4]
[ 0.6]
[ 0.7]
[ 0.9]
[ 0.9]]
[[ 0. 0.6 0.8 ]
[ 0.13736056 0.82416338 0.54944226]]
[[ 9.80897665e-01 8.94462891e-04 1.79657674e-02 1.21052389e-04
1.21052389e-04]
[ 8.78679856e-01 1.18916387e-01 8.01252314e-04 8.01252314e-04
8.01252314e-04]]2、内积、L1/L2损失函数
import time
import numpy as np

x1 = [9, 2, 5, 0, 0, 7, 5, 0, 0, 0, 9, 2, 5, 0, 0]
x2 = [9, 2, 2, 9, 0, 9, 2, 5, 0, 0, 9, 2, 5, 0, 0]

# 1 dot product、outer product、elementwise、general dot product

dot = 0
for i in range(len(x1)):
    dot += x1[i]*x2[i]

outer = np.zeros((len(x1),len(x2)))
for i in range(len(x1)):
    for j in range(len(x2)):
        outer[i,j] = x1[i]*x2[j]

mul = np.zeros(len(x1))
for i in range(len(x1)):
    mul[i] = x1[i]*x2[i]

W = np.random.rand(3,len(x1))
gdot = np.zeros(W.shape[0])
for i in range(W.shape[0]):
    for j in range(len(x1)):
        gdot[i] += W[i,j]*x1[j]

#print(dot)
#print(outer)
#print(mul)

# 2、向量化实现
dot = np.dot(x1,x2)
outer = np.outer(x1,x2)
mul = np.multiply(x1,x2)

#print(dot)
#print(outer)
#print(mul)

def L1(yhat,y):
    loss = np.sum(np.abs(y-yhat))
    return loss
def L2(yhat,y):
    loss = np.sum(np.power((y-yhat),2))
    return loss

if __name__=="__main__":
    yhat = np.array([0.9,0.2,0.1,0.4,0.9])
    y = np.array([1,0,0,1,1])
    print(L1(yhat,y))
    print(L2(yhat,y))
1.1
0.43
3、数据集
import numpy as np
import h5py


def load_dataset():
    train_dataset = h5py.File('datasets/train_catvnoncat.h5', "r")
    train_set_x_orig = np.array(train_dataset["train_set_x"][:]) # your train set features
    train_set_y_orig = np.array(train_dataset["train_set_y"][:]) # your train set labels

    test_dataset = h5py.File('datasets/test_catvnoncat.h5', "r")
    test_set_x_orig = np.array(test_dataset["test_set_x"][:]) # your test set features
    test_set_y_orig = np.array(test_dataset["test_set_y"][:]) # your test set labels

    classes = np.array(test_dataset["list_classes"][:]) # the list of classes

    train_set_y_orig = train_set_y_orig.reshape((1, train_set_y_orig.shape[0]))
    test_set_y_orig = test_set_y_orig.reshape((1, test_set_y_orig.shape[0]))

    return train_set_x_orig, train_set_y_orig, test_set_x_orig, test_set_y_orig, classes

if __name__=="__main__":
    train_set_x_orig, train_set_y, test_set_x_orig, test_set_y, classes = load_dataset()

    print(train_set_x_orig.shape,test_set_x_orig.shape,train_set_y.shape,test_set_y.shape,classes.shape)

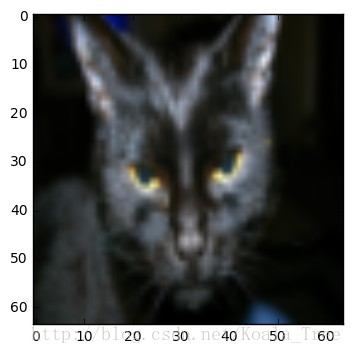
    x = train_set_x_orig[25]
    print(x.shape)
4、神经网络模型
import numpy as np
import matplotlib.pyplot as plt
import h5py
import scipy
import pylab
from PIL import Image
from lr_utils import load_dataset
from scipy import ndimage

# 1、下载数据集
train_set_x_orig, train_set_y, test_set_x_orig, test_set_y, classes = load_dataset()

# 2、显示图像
index = 90
#plt.imshow(train_set_x_orig[index])
#pylab.show()   # 加上才能显示图片
# squeeze()函数:除去size=1的维度,(4,1,3)变成(4,3),(4,2,3)则不变
print ("y = " + str(train_set_y[:, index]) + ", it's a '" \
    + classes[np.squeeze(train_set_y[:, index])].decode("utf-8") +  "' picture.")

# 3、显示图像大小
m_train = train_set_x_orig.shape[0]
m_test  = test_set_x_orig.shape[0]
num_px  = train_set_x_orig.shape[1]

print("TrainSet:   " + str(train_set_x_orig.shape))
print("TestSet:    " + str(test_set_x_orig.shape))
print("TrainLabel: " + str(train_set_y.shape))
print("TestLabel:  " + str(test_set_y.shape))

# 4、reshape图片,且转换成列向量
train_set_x_flatten = train_set_x_orig.reshape(train_set_x_orig.shape[0],-1).T
test_set_x_flatten  = test_set_x_orig.reshape(test_set_x_orig.shape[0],-1).T
print(train_set_x_flatten.shape,test_set_x_flatten.shape)

# 5、标准化数据集
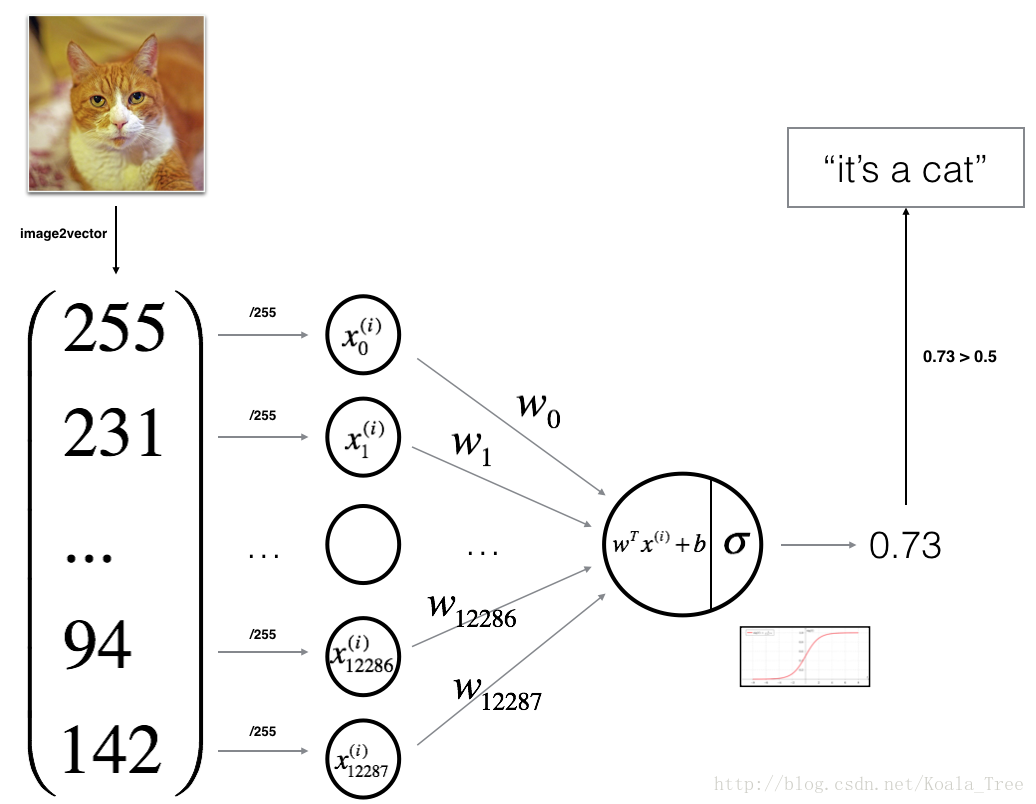
train_set_x = train_set_x_flatten/255
test_set_x  = test_set_x_flatten/255

# 6、
def sigmoid(z):
    s = 1.0/(1 + np.exp(-z))
    return s

# 7、初始化参数
def initialize_zeros(dim):
    w = np.zeros([dim,1])
    b = 0
    assert(w.shape == (dim,1))
    assert(isinstance(b,float) or isinstance(b,int))
    return w,b

# 8、forward and backward propagation
# 计算损失函数、梯度
def propagate(w,b,x,y):
    '''
    function:
        implement the cost function and gradient

    Arguments:
        w --- 权重 (num_px*num_px*3, 1)
        b --- 偏置
        X --- 输入 (num_px*num_px*3, 样本数)
        Y --- 标签

    return:
        cost --- 逻辑回归的 log 损失函数
        dw   ---
        db   ---
    '''
    m = x.shape[1]
    # 前向传播
    y_   = sigmoid(np.dot(w.T,x) + b)
    cost = -(1.0/m)*np.sum(y*np.log(y_) + (1-y)*np.log(1-y_))
    # 后向传播
    dw = (1.0/m)*np.dot(x,(y_-y).T)
    db = (1.0/m)*np.sum(y_-y)

    assert(dw.shape == w.shape)
    assert(db.dtype == float)
    cost = np.squeeze(cost)
    assert(cost.shape == ())
    grads = {"dw":dw, "db":db}

    return grads,cost

w,b,x,y = np.array([[1.],[2.]]), 2, np.array([[1,2,-1],[3,4,-3]]), np.array([[1,0,1]])
grads, cost = propagate(w,b,x,y)
print(grads,cost)

# 9、optimization 优化算法(梯度下降)
def optimize(w, b, x, y, num_iterations, learning_rate, print_cost = False):
    '''
    rerutn: params, grads, cost
    '''
    costs = []
    for i in range(num_iterations):
        grads,cost = propagate(w,b,x,y)

        dw = grads["dw"]
        db = grads["db"]

        w = w - dw*learning_rate
        b = b - db*learning_rate

        if i % 100 == 0:
            costs.append(cost)

        if print_cost and i%100==0:
            print("cost after iteration %i : %f" %(i,cost))

    params = {"w":w, "b":b}
    grads  = {"dw":dw, "db":db}

    return params,grads,costs

params, grads, costs = optimize(w, b, x, y, num_iterations= 100, learning_rate = 0.009, print_cost = False)
print(params,grads)

# 10、预测
def predict(w,b,x):
    m = x.shape[1]
    y_p = np.zeros([1,m])
    w = w.reshape(x.shape[0],1)
    y_ = sigmoid(np.dot(w.T,x)+b)

    for i in range(y_.shape[1]):
        if y_[0,i] > 0.5:
            y_p[0,i]=1
        else:
            y_p[0,i]=0

    assert(y_p.shape == (1,m))

    return y_p

w = np.array([[0.1124579],[0.23106775]])
b = -0.3
x = np.array([[1.,-1.1,-3.2],[1.2,2.,0.1]])
print ("predictions = " + str(predict(w, b, x)))

# 11、将所有的功能合并到模型中
def model(x_train, y_train, x_test, y_test, num_iterations=2000, learning_rate=0.5, print_cost=False):
    w,b = initialize_zeros(x_train.shape[0])
    parameters,grads,costs = optimize(w,b,x_train,y_train,num_iterations,learning_rate,print_cost)
    w = parameters["w"]
    b = parameters["b"]
    y_p_train = predict(w,b,x_train)
    y_p_test  = predict(w,b,x_test)

    print("train accuracy:{} %".format(100-np.mean(np.abs(y_p_train-y_train))*100))
    print("test accuracy:{} % ".format(100-np.mean(np.abs(y_p_test-y_test))*100))
    d = {"costs":costs,
         "y_p_train":y_p_train,
         "y_p_test":y_p_test,
         "w":w,
         "b":b,
         "learning_rate":learning_rate,
         "num_iterations":num_iterations}
    return d

# 训练集正确率99%,测试集正确率70%,过拟合了
d = model(train_set_x,train_set_y,test_set_x,test_set_y,num_iterations=2000,learning_rate=0.005,print_cost=True)


# 12、画出代价函数和梯度
'''
costs = np.squeeze(d["costs"])
plt.plot(costs)
plt.ylabel("cost")
plt.xlabel("iterations(per hundreds)")
plt.title("learning rate = "+str(d["learning_rate"]))
plt.show()
'''
# 13、学习率的选择

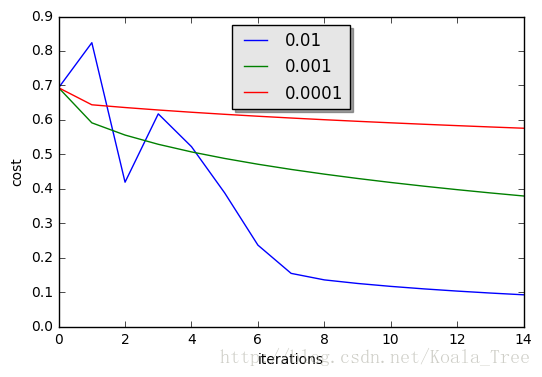
learning_rate = [0.01,0.001,0.0001]
models = {}
for i in learning_rate:
    print("learning rate is: " + str(i))
    models[str(i)] = model(train_set_x,train_set_y,test_set_x,test_set_y,
                           num_iterations=1500,learning_rate=i,print_cost=False)

for i in learning_rate:
    plt.plot(np.squeeze(models[str(i)]["costs"]), label=str(models[str(i)]["learning_rate"]))
plt.ylabel("cost")
plt.xlabel("iteration")

legend = plt.legend(loc='upper center', shadow=True)
frame = legend.get_frame()
frame.set_facecolor('0.90')
plt.show()

'''
# 14、用自己的图像来测试
fname = 'images/other_test.jpg'
image = np.array(ndimage.imread(fname,flatten=False))
my_image = scipy.misc.imresize(image,size=(num_px,num_px)).reshape((1,num_px*num_px*3)).T
my_predicted_image = predict(d["w"],d["b"],my_image)

plt.imshow(image)
pylab.show()
print("y = " + str(np.squeeze(my_predicted_image)) + ", your algorithm predicts a \"" \
    + classes[int(np.squeeze(my_predicted_image)),].decode("utf-8") +  "\" picture.")
'''
y = [0], it's a 'non-cat' picture.
TrainSet: (209, 64, 64, 3)
TestSet: (50, 64, 64, 3)
TrainLabel: (1, 209)
TestLabel: (1, 50)
(12288, 209) (12288, 50)
{'dw': array([[ 0.99772382],
[ 2.3265089 ]]), 'db': 0.002187770724565441} 5.66894829829
{'b': 1.9241133755874054, 'w': array([[ 0.18954212],
[ 0.16465723]])} {'dw': array([[ 0.69128662],
[ 1.43797759]]), 'db': 0.2187345002480347}
predictions = [[ 1. 1. 0.]]
cost after iteration 0 : 0.693147
cost after iteration 100 : 0.584508
cost after iteration 200 : 0.466949
cost after iteration 300 : 0.376007
cost after iteration 400 : 0.331463
cost after iteration 500 : 0.303273
cost after iteration 600 : 0.279880
cost after iteration 700 : 0.260042
cost after iteration 800 : 0.242941
cost after iteration 900 : 0.228004
cost after iteration 1000 : 0.214820
cost after iteration 1100 : 0.203078
cost after iteration 1200 : 0.192544
cost after iteration 1300 : 0.183033
cost after iteration 1400 : 0.174399
cost after iteration 1500 : 0.166521
cost after iteration 1600 : 0.159305
cost after iteration 1700 : 0.152667
cost after iteration 1800 : 0.146542
cost after iteration 1900 : 0.140872
train accuracy:99.04306220095694 %
test accuracy:70.0 %
learning rate is: 0.01
train accuracy:99.52153110047847 %
test accuracy:68.0 %
learning rate is: 0.001
train accuracy:88.99521531100478 %
test accuracy:64.0 %
learning rate is: 0.0001
train accuracy:68.42105263157895 %
test accuracy:36.0 %
总结:
1、归一化后的数据,梯度下降收敛速度更快
2、构建学习算法结构、初始化参数、计算损失函数和梯度、梯度下降优化算法
3、学习算法的一般结构
初始化模型参数
通过最小化损失函数,学习模型参数
使用学习后的参数去预测新数据
分析结果
4、出现了过拟合,增加迭代步数,训练集正确率上升,测试集正确率下降
5、学习率的选择
学习率决定更新参数的速度
学习率太高,可能会超过最优值,
学习率太小,收敛速度慢


 1100
1100

 被折叠的 条评论
为什么被折叠?


