


本节目标:
(1) 绘制空心星形
这个的结果是这样的:
(1) 绘制空心星形
实现步骤:
续前节,本节我想要绘制一些空心的星形。本来我想用点的递推法来绘制,这样就先封装了正多边形的绘制函数。
/**
* @usage 以顶点递推方式绘制正多边形
* @author mw
* @date 2015年12月01日 星期二 09:42:33
* @param (x, y)图形中心坐标,r 外接圆半径 edge 边数
* @return
*
*/
//{Shape类}
this.nEdge = function(x, y, r, edge) {
plot.save();
//plot.translate(x, y);
//strokeCircle(x, y, r);
var perAngle = Math.PI * 2 / edge;
var a = r * Math.sin(perAngle / 2);
var xOff = a;
var yOff = r*Math.cos(perAngle / 2);
plot.translate(-xOff , -yOff);
var x1 = x;
var y1 = y;
var x2 = x1 + 2 * a;
var y2 = y1;
var xArray = new Array(x1, x2);
var yArray = new Array(y1, y2);
var angle = 0;
for (var i=0; i < edge; i++) {
x2 = x1 + 2 * a * Math.cos(angle);
y2 = y1 + 2 * a * Math.sin(angle);
xArray.push(x2);
yArray.push(y2);
x1 = x2;
y1 = y2;
angle += perAngle;
}
plot.moveTo(xArray[0], yArray[0]);
for (var i=1; i< xArray.length; i++) {
plot.lineTo(xArray[i], yArray[i]);
}
plot.stroke()
.restore();
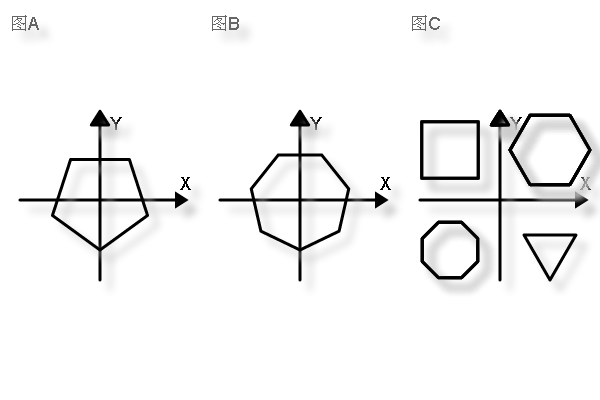
}用一个Demo测试一下。
		var shape = new Shape();
		setSector(row, col, 1, 1);
		plot.fillText("图A", -width/col+10, -height/row+30, maxWidth);
		axis(0, 0, 80);
		shape.nEdge(0, 0, 50, 5);

		setSector(row, col, 1, 2);
		plot.fillText("图B", -width/col+10, -height/row+30, maxWidth);
		axis(0, 0, 80);
		shape.nEdge(0, 0, 50, 7);

		setSector(row, col, 1, 3);
		plot.fillText("图C", -width/col+10, -height/row+30, maxWidth);
		axis(0, 0, 80);
		shape.nEdge(50, -50, 40, 6);
		shape.nEdge(-50, 50, 30, 8);
		shape.nEdge(-50, -50, 40, 4);
		shape.nEdge(50, 50, 30, 3);
结果如图
接下来想从多边形顶点往外推星星角的顶点却遇到了很多的麻烦,尤其是同心和偏移这些方面,顶点很难算。所以采用了简单算法。
/**
* @usage   空心星形
* @author  mw
* @date    2015年12月01日  星期二  10:06:13
* @param
* @return
*
*/
		this.nStar = function(x, y, r, edge) {
			plot.save();
			plot.translate(x, y);

			var perAngle = Math.PI * 2 / edge;

			var r0 = r * 0.6;

			var xArray = new Array();
			var yArray = new Array();

			for (var i =0; i<edge; i++) {
				xArray.push(r0 * Math.cos(i * perAngle));
				yArray.push(r0 * Math.sin(i * perAngle));
				xArray.push(r * Math.cos(i * perAngle + perAngle));
				yArray.push(r * Math.sin(i * perAngle + perAngle));
			}

			plot.beginPath()
				.moveTo(xArray[0], yArray[0]);
			for (var i=0; i < xArray.length; i++) {
				plot.lineTo(xArray[i], yArray[i]);
			}
			plot.closePath()
				.stroke()
				.restore();

		}
/**
* @usage 绘制空心星形
* @author mw
* @date 2015年12月01日 星期二 08:26:53
* @param
* @return
*
*/
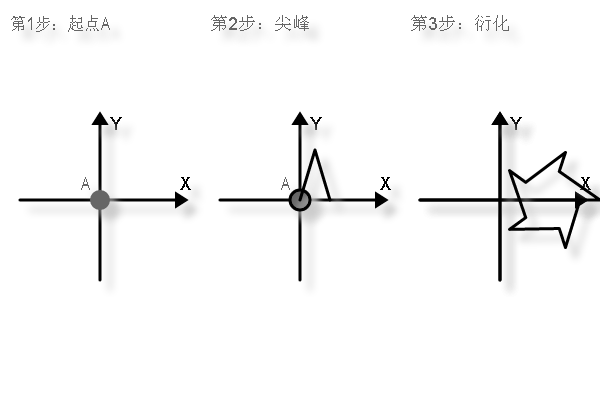
function myplot() {
plot.init();
setPreference();
var row = 1;
var col = 3;
var width = 300;
var height = 200;
var maxWidth = width/col;
//<1>
setSector(row, col, 1, 1);
plot.fillText("第1步:起点A", -width/col+10, -height/row+30, maxWidth);
axis(0,0,80);
plot.fillText("A", -20,-10, 10);
fillCircle(0,0,10);
//<2>
setSector(row, col, 1, 2);
axis(0,0,80);
plot.fillText("第2步:尖峰", -width/col+10, -height/row+30, maxWidth);
plot.fillText("A", -20,-10, 10);
fillCircle(0,0,10);
plot.moveTo(0, 0)
.lineTo(15, -50)
.lineTo(30,0)
.stroke();
//<3>
setSector(row, col, 1, 3);
plot.fillText("第3步:衍化", -width/col+10, -height/row+30, maxWidth);
axis(0,0,80);
axis(0,0,80);
var shape = new Shape();
shape.nStar(50, 0, 50, 5);
//shape.nEdge(50, 50, 50, 5);
}
这个的结果是这样的。
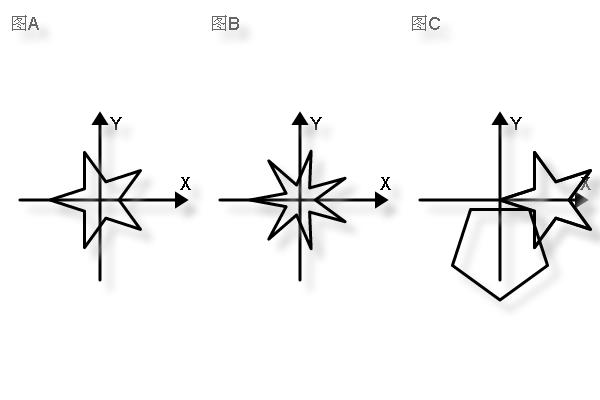
		var shape = new Shape();
		//<1>
		setSector(row, col, 1, 1);
		plot.fillText("图A", -width/col+10, -height/row+30, maxWidth);
		axis(0,0,80);

		shape.nStar(0, 0, 50, 5);

		//<2>
		setSector(row, col, 1, 2);
		axis(0,0,80);
		plot.fillText("图B", -width/col+10, -height/row+30, maxWidth);
		shape.nStar(0, 0, 50, 7);


		//<3>
		setSector(row, col, 1, 3);
		plot.fillText("图C", -width/col+10, -height/row+30, maxWidth);
		axis(0,0,80);
		shape.nStar(50, 0, 50, 5);
		shape.nEdge(0, 50, 50, 5);
这个的结果是这样的:

大部分时候这种非对称的星星最好看,但是怎样得到那种尖峰很正的星星呢?所以我就去改动绘制参数。当最终函数变成这样的时候。
/**
* @usage 空心星形
* @author mw
* @date 2015年12月01日 星期二 10:06:13
* @param
* @return
*
*/
this.nStar = function(x, y, r, edge) {
plot.save();
plot.translate(x, y);
var perAngle = Math.PI * 2 / edge;
//r0 = 0.6 * r;
var r0 = r / 2 /(1 + Math.cos(perAngle));
var xArray = new Array();
var yArray = new Array();
for (var i =0; i<edge; i++) {
xArray.push(r0 * Math.cos(i * perAngle));
yArray.push(r0 * Math.sin(i * perAngle));
xArray.push(r * Math.cos(i * perAngle + 0.5 * perAngle));
yArray.push(r * Math.sin(i * perAngle + 0.5 * perAngle));
}
plot.beginPath()
.moveTo(xArray[0], yArray[0]);
for (var i=0; i < xArray.length; i++) {
plot.lineTo(xArray[i], yArray[i]);
}
plot.closePath()
.stroke()
.restore();
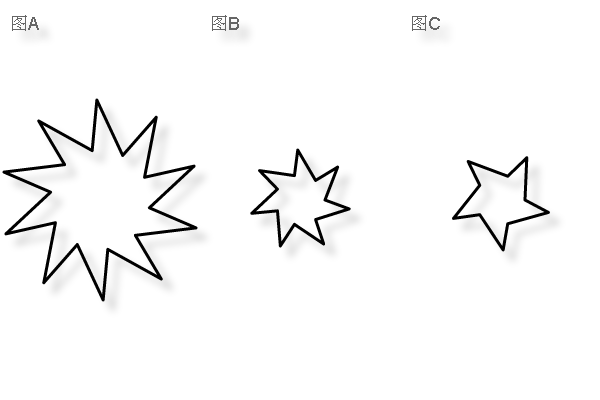
}结果图是:
这个看上去好像就很正点了。
在这个过程中,还发现了其它有意思的图形。比如缩小r0的值,会得出这样的图:

而放大旋转效应,会得到这样的图:

至于缩小旋转效应:
让旋转因子变得很大并且不让它们同步,比如设成这样:
				xArray.push(r * Math.cos(i * perAngle + 77 * perAngle));
				yArray.push(r * Math.sin(i * perAngle + 100 * perAngle));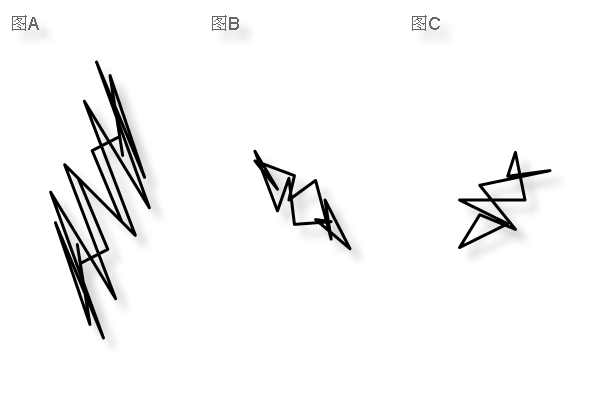
而如果让内外圆半径倒挂,比如
	//r0 = 0.6 * r;
			//var r0 = r / 2 /(1 + Math.cos(perAngle));
var r0 = 2 * r;会得到

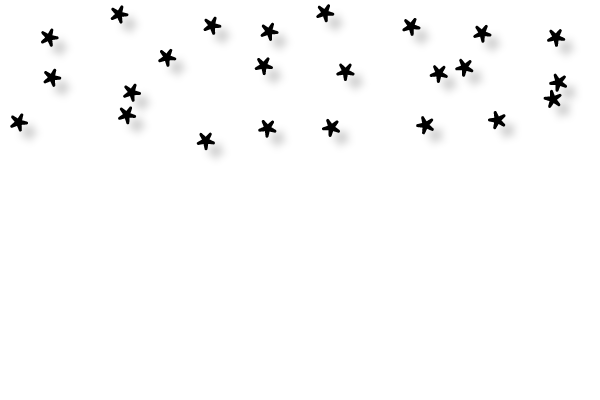
其它的漂亮的图还有很多,只需要调整参数就行了。
比如


 849
849


 被折叠的 条评论
为什么被折叠?
被折叠的 条评论
为什么被折叠?
 到【灌水乐园】发言


