


 本文介绍如何利用LeakTracer检测Android NDK C++代码中的内存泄露问题,通过具体步骤演示如何设置环境、配置项目及分析泄露结果。
前言
最近写C++代码,老是担心代码存在内存泄露,胆战心惊的,Andorid中Java层代码内存泄露可以借助leakcanary进行检测;找了一番,找到了PC上C++上的内存泄露检测库LeakTracer,于是再找了下,找到了Android上的移植版。
首先建立一个项目,在根目录下建立thirdparty目录,进入该目录,clone相关库代码
|
1
|
git
clone
git@github.com:lizhangqu/LeakTracer.git
|
在项目src/main/cpp下建立CMakeLists.txt,内容如下
|
1
2
3
4
5
6
7
8
9
10
11
12
13
14
15
16
17
18
19
20
21
22
23
24
25
26
27
28
29
30
31
|
project(Test)
cmake_minimum_required (VERSION 3.6)
include_directories(
${PROJECT_SOURCE_DIR}/include/
${PROJECT_SOURCE_DIR}/
../
../
../
../thirdparty/LeakTracer/libleaktracer/include/
)
set(LEAKTRACER_SOURCES
${PROJECT_SOURCE_DIR}/
../
../
../
../thirdparty/LeakTracer/libleaktracer/src/AllocationHandlers.cpp
#
${PROJECT_SOURCE_DIR}/
../
../
../
../thirdparty/LeakTracer/libleaktracer/src/LeakTracerC.c
#检测c代码时打开此注释,否则不要打开
${PROJECT_SOURCE_DIR}/
../
../
../
../thirdparty/LeakTracer/libleaktracer/src/MemoryTrace.cpp
)
add_library(leaktracer STATIC
${LEAKTRACER_SOURCES})
set(TEST_FILES
${CMAKE_SOURCE_DIR}/native.cpp
)
add_library(
test-jni
SHARED
${TEST_FILES})
target_link_libraries(
test-jni
leaktracer
log
)
|
建立src/main/cpp/include/native.h和src/main/cpp/native.cpp文件
native.h
|
1
2
3
4
5
6
7
8
9
10
11
12
13
14
15
16
17
18
19
20
21
22
23
24
25
26
27
28
29
30
31
32
33
34
35
36
37
38
|
//
// Created by 李樟取 on 2017/6/4.
//
ifndef TEST_H
define TEST_H
include "jni.h"
ifndef NELEM
define NELEM(x) ((int) (sizeof(x) / sizeof((x)[0])))
endif
ifndef CLASSNAME
define CLASSNAME "io/github/lizhangqu/test/Test"
endif
ifdef ANDROID
include <android/log.h>
define TAG "Test"
define ALOGE(fmt, ...) __android_log_print(ANDROID_LOG_ERROR, TAG, fmt, ##__VA_ARGS__)
define ALOGI(fmt, ...) __android_log_print(ANDROID_LOG_INFO, TAG, fmt, ##__VA_ARGS__)
define ALOGD(fmt, ...) __android_log_print(ANDROID_LOG_DEBUG, TAG, fmt, ##__VA_ARGS__)
define ALOGW(fmt, ...) __android_log_print(ANDROID_LOG_WARN, TAG, fmt, ##__VA_ARGS__)
else
define ALOGE printf
define ALOGI printf
define ALOGD printf
define ALOGW printf
endif
endif //TEST_H
|
native.cpp
|
1
2
3
4
5
6
7
8
9
10
11
12
13
14
15
16
17
18
19
20
21
22
23
24
25
26
27
28
29
30
31
32
33
34
35
36
37
38
39
40
41
|
void test(JNIEnv *env, jobject thiz) {
}
static
const JNINativeMethod sMethods[] = {
{
const_cast<
char *>(
"test"),
const_cast<
char *>(
"()V"),
reinterpret_cast<
void *>(test)
},
};
int registerNativeMethods(JNIEnv *env, const char *className, const JNINativeMethod *methods,
const int numMethods) {
jclass clazz = env->FindClass(className);
if (!clazz) {
ALOGE(
"Native registration unable to find class '%s'\n", className);
return JNI_FALSE;
}
if (env->RegisterNatives(clazz, methods, numMethods) !=
0) {
ALOGE(
"RegisterNatives failed for '%s'\n", className);
env->DeleteLocalRef(clazz);
return JNI_FALSE;
}
env->DeleteLocalRef(clazz);
return JNI_TRUE;
}
jint JNI_OnLoad(JavaVM *vm, void *reserved) {
JNIEnv *env;
if (vm->GetEnv(
reinterpret_cast<
void **>(&env), JNI_VERSION_1_6) != JNI_OK) {
return
-1;
}
registerNativeMethods(env, CLASSNAME, sMethods, NELEM(sMethods));
return JNI_VERSION_1_6;
}
|
编写test函数,简单进行内测泄露检测
|
1
2
3
4
5
6
7
8
9
10
11
12
13
14
15
16
17
|
class MemoryTest {
};
void test(JNIEnv *env, jobject thiz) {
leaktracer::MemoryTrace::GetInstance().startMonitoringAllThreads();
MemoryTest *memoryTest =
new MemoryTest;
leaktracer::MemoryTrace::GetInstance().stopAllMonitoring();
std::ofstream out;
out.open(
"/sdcard/leaks.out",
std::ios_base::out);
if (out.is_open()) {
leaktracer::MemoryTrace::GetInstance().writeLeaks(out);
}
else {
ALOGE(
"Failed to write to \"leaks.out\"\n");
}
}
|
运行程序后调用test函数,将/sdcard/leaks.out pull到项目根目录
|
1
|
adb pull /sdcard/leaks.
out
|
其内容类似如下内容
|
1
2
|
# LeakTracer report diff_utc_mono=1496511718.682943
leak,
time=135120.534718,
stack=0x36fd6 0x35a90 0x359a4 0x32fea 0xc952d3d0,
size=1,
data=�
|
借助thirdparty/LeakTracer/helper/leak-analyze-addr2line工具还原内测泄露堆栈。
进入项目根目录,执行leak-analyze-addr2line
|
1
|
.
/thirdparty/LeakTracer
/helpers/leak-analyze-addr2line .
/library/build
/intermediates/cmake
/debug/obj
/armeabi/libtest-jni.so .
/leaks.out
|
在mac上,会出现一个错误,原因是leak-analyze-addr2line中用到了addr2line工具,而mac上如果没有此工具,就会报错,错误如下:
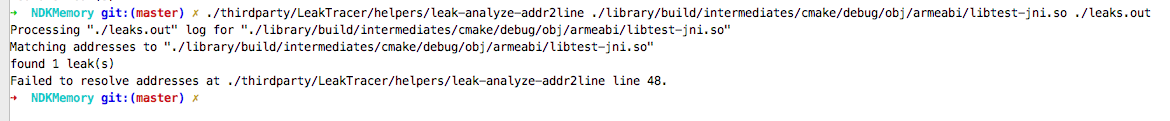
解决方法很简单,将ndk目录中的arm-linux-androideabi-addr2line拷到./thirdparty/LeakTracer/helpers/下,并重命名为addr2line,然后将./thirdparty/LeakTracer/helpers/加到环境变量中,如下代码
|
1
2
|
cp
$ANDROID_NDK_HOME/toolchains/arm-linux-androideabi-
4.9/prebuilt/darwin-x86_64/bin/arm-linux-androideabi-addr2line ./thirdparty/LeakTracer/helpers/addr2line
export PATH=
$PATH
:`pwd`/thirdparty/LeakTracer/helpers
|
$ANDROID_NDK_HOME表示ndk的根目录。
之后再次调用命令
|
1
|
.
/thirdparty/LeakTracer
/helpers/leak-analyze-addr2line .
/library/build
/intermediates/cmake
/debug/obj
/armeabi/libtest-jni.so .
/leaks.out
|
这时候输出如下
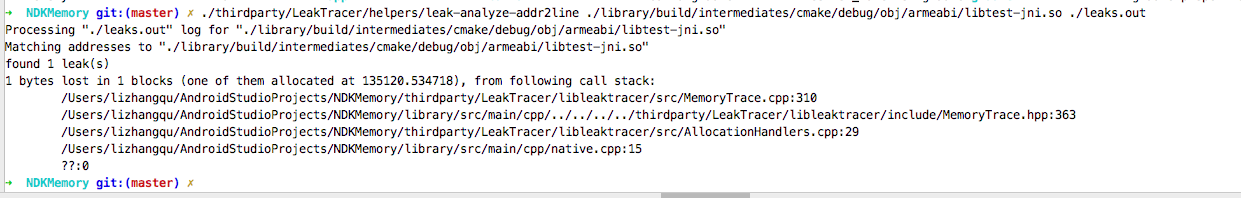
native.cpp:15行出现泄露,找到15行对应的代码,即如下代码出现泄露
|
1
|
MemoryTest *memoryTest =
new
MemoryTest;
|
加入delete代码,再跑一次
|
1
2
|
MemoryTest *memoryTest = new MemoryTest
;
delete memoryTest
;
|
输出如下

发现之前的泄露不见了
最后,值得注意的是,要想使用LeakTracer需要保留so足够多的debug信息,否则可能不能正常检测。
项目Demo地址见NDKMemoryLeakSample


 3565
3565

 被折叠的 条评论
为什么被折叠?
被折叠的 条评论
为什么被折叠?
 到【灌水乐园】发言


