


 文章详细介绍了matplotlib库中的Wedge类,它是从Patch类继承而来的,用于创建扇形图形。Wedge类的关键参数包括中心点坐标、半径、起始和终止角度以及可选的宽度。通过调整这些参数,可以绘制不同角度和宽度的扇形,常用于饼状图和环状图的制作。文章通过示例代码展示了如何使用Wedge类以及其在饼状图中的应用。
概述
以下是 maplotlib 库中的继承图:
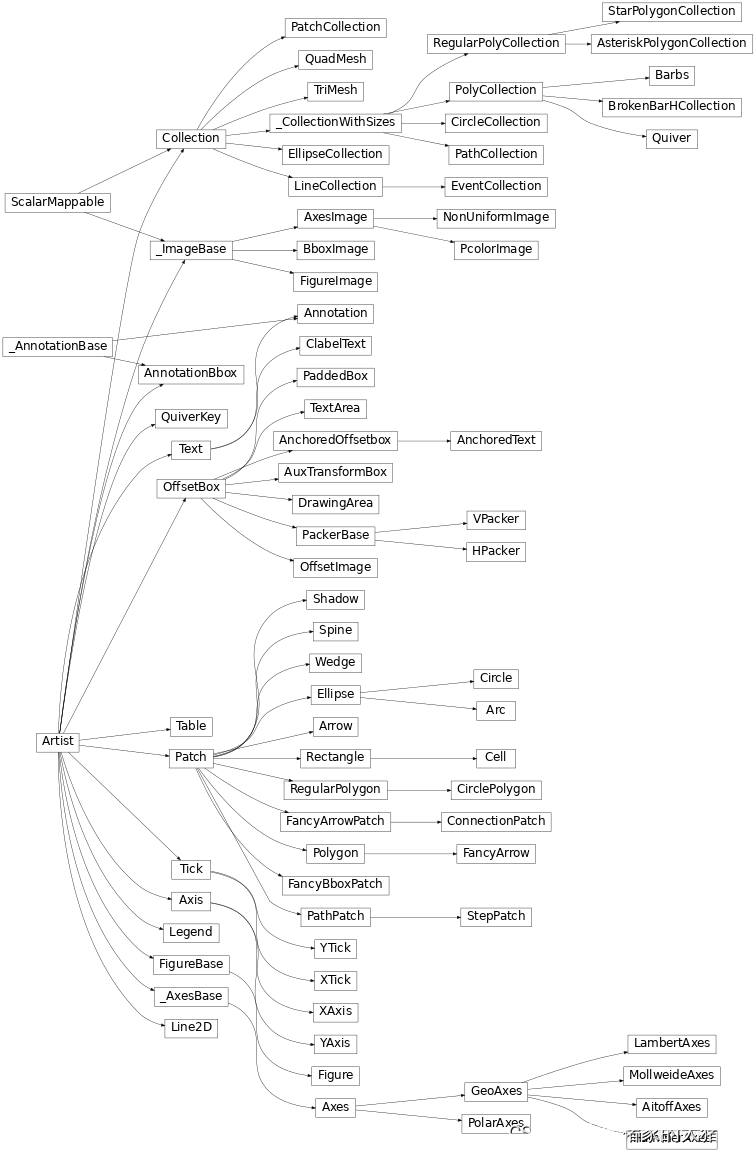
从上图可以看出 Wedge 类继承自 Patch 类,这就意味着 Wedge 类具有块的相关属性,也可以看出 Wedge 类是一个可以放到画布中的实体类,官方文档中对该类的定义如下:
A wedge centered at x, y center with radius r that sweeps theta1 to theta2 (in degrees). If width is given, then a partial wedge is drawn from inner radius r - width to outer radius r.
翻译过来就是一个给定中心、半径、起始角度和终止角度的扇形,wedge 类的定义如下:
class Wedge(Patch):
	def __init__(self, center, r, theta1, theta2, width=None, **kwargs):
		...
参数说明:
- Center:指定扇形中点;
- R:指定扇形半径;
- Theta1:指定扇形起始角度;
- Theta2:指定扇形终止角度;
- Width:指定扇形宽度,如果给出宽度,则只会绘制部分扇形;
- Kwargs:其他 Patch 类关键字参数;
参数详解
角度
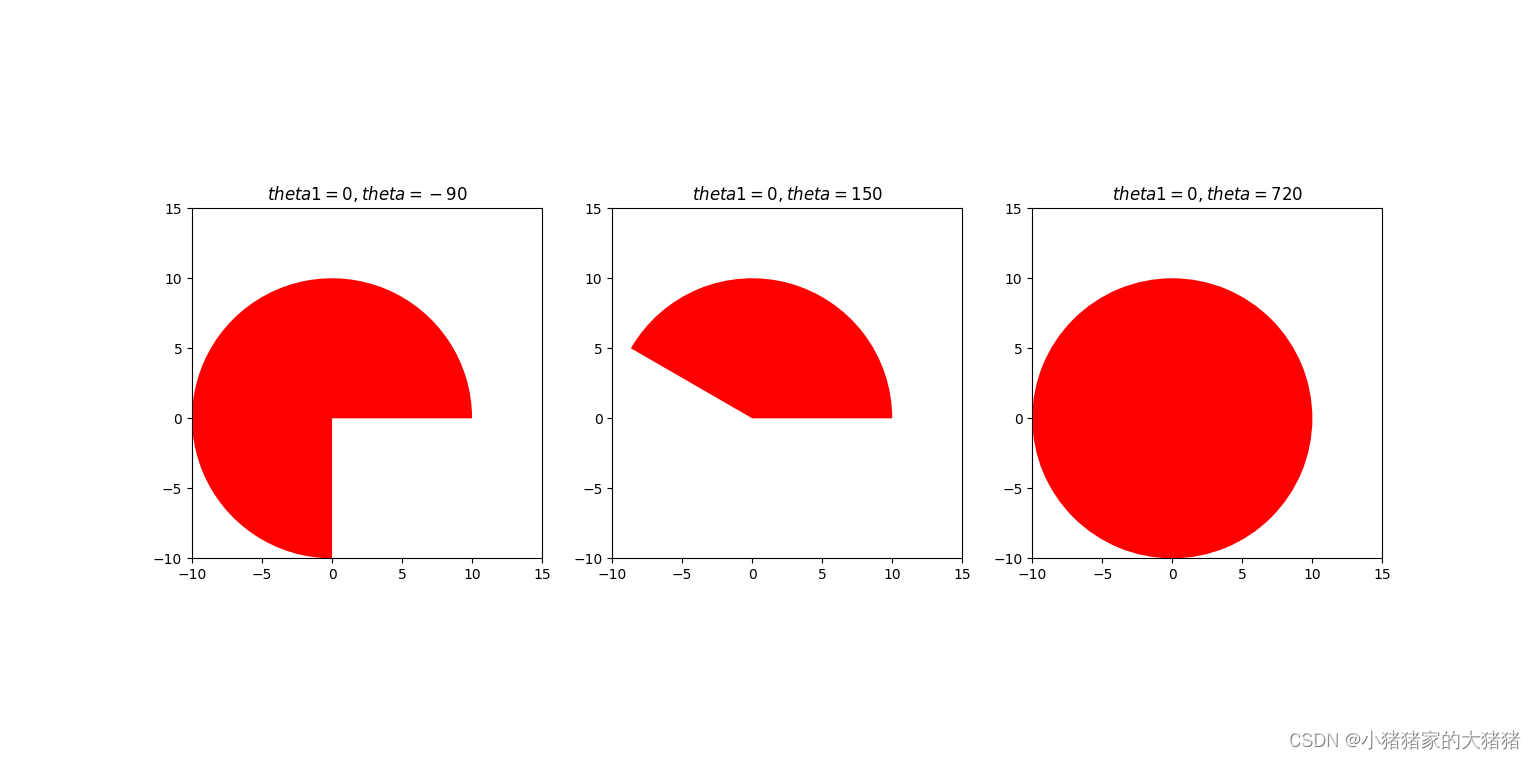
Theta1 和 theta2 角度共同控制扇形的角度,theta1 控制起始角度,theta2 控制终止角度。以 X 轴正向为 0°逆时针为正向,接下里本文将以多组角度帮助大家更好的理解相关参数。完整代码如下:
import matplotlib.pyplot as plt
from matplotlib.patches import Wedge

wedge1 = Wedge((0, 0), 10, 0, -90, facecolor='red')
wedge2 = Wedge((0, 0), 10, 0, 150, facecolor='red')
wedge3 = Wedge((0, 0), 10, 0, 720, facecolor='red')
fig, ax = plt.subplots(1, 3)

ax[0].add_artist(wedge1)
ax[0].set_title("$theta1=0, theta=-90$")
ax[1].add_artist(wedge2)
ax[1].set_title("$theta1=0, theta=150$")
ax[2].add_artist(wedge3)
ax[2].set_title("$theta1=0, theta=720$")

for a in ax:
    a.set_xlim([-10, 15])
    a.set_ylim([-10, 15])
    a.set_aspect('equal', adjustable='box')

plt.show()
画图结果如下:
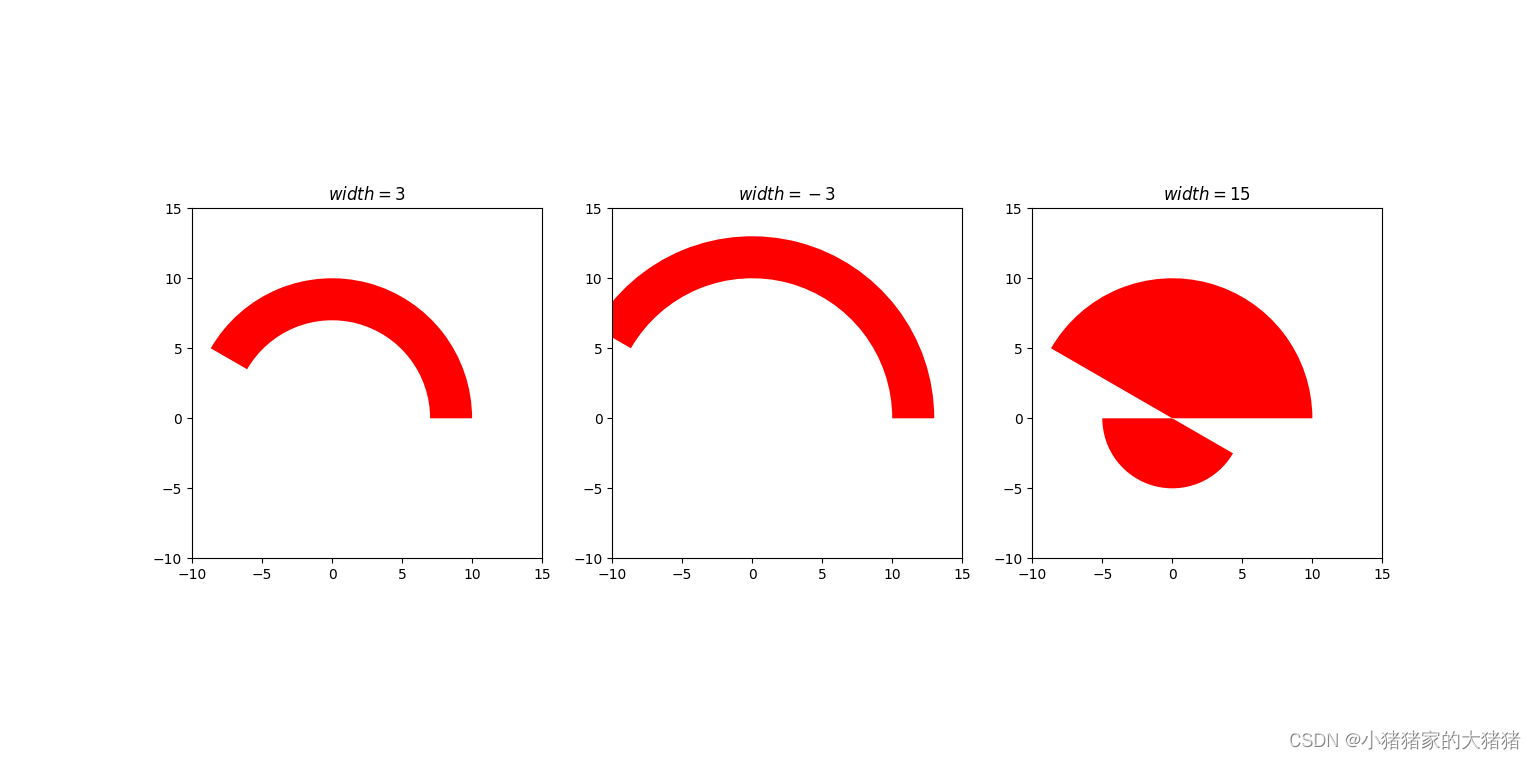
Width
Width 参数控制扇形宽度,示例代码如下:
import matplotlib.pyplot as plt
from matplotlib.patches import Wedge

wedge1 = Wedge((0, 0), 10, 0, 150, facecolor='red', width=3)
wedge2 = Wedge((0, 0), 10, 0, 150, facecolor='red', width=-3)
wedge3 = Wedge((0, 0), 10, 0, 150, facecolor='red', width=15)
fig, ax = plt.subplots(1, 3)

ax[0].add_artist(wedge1)
ax[0].set_title("$width=3$")
ax[1].add_artist(wedge2)
ax[1].set_title("$width=-3$")
ax[2].add_artist(wedge3)
ax[2].set_title("$width=15$")

for a in ax:
    a.set_xlim([-10, 15])
    a.set_ylim([-10, 15])
    a.set_aspect('equal', adjustable='box')

plt.show()
画图结果如下:
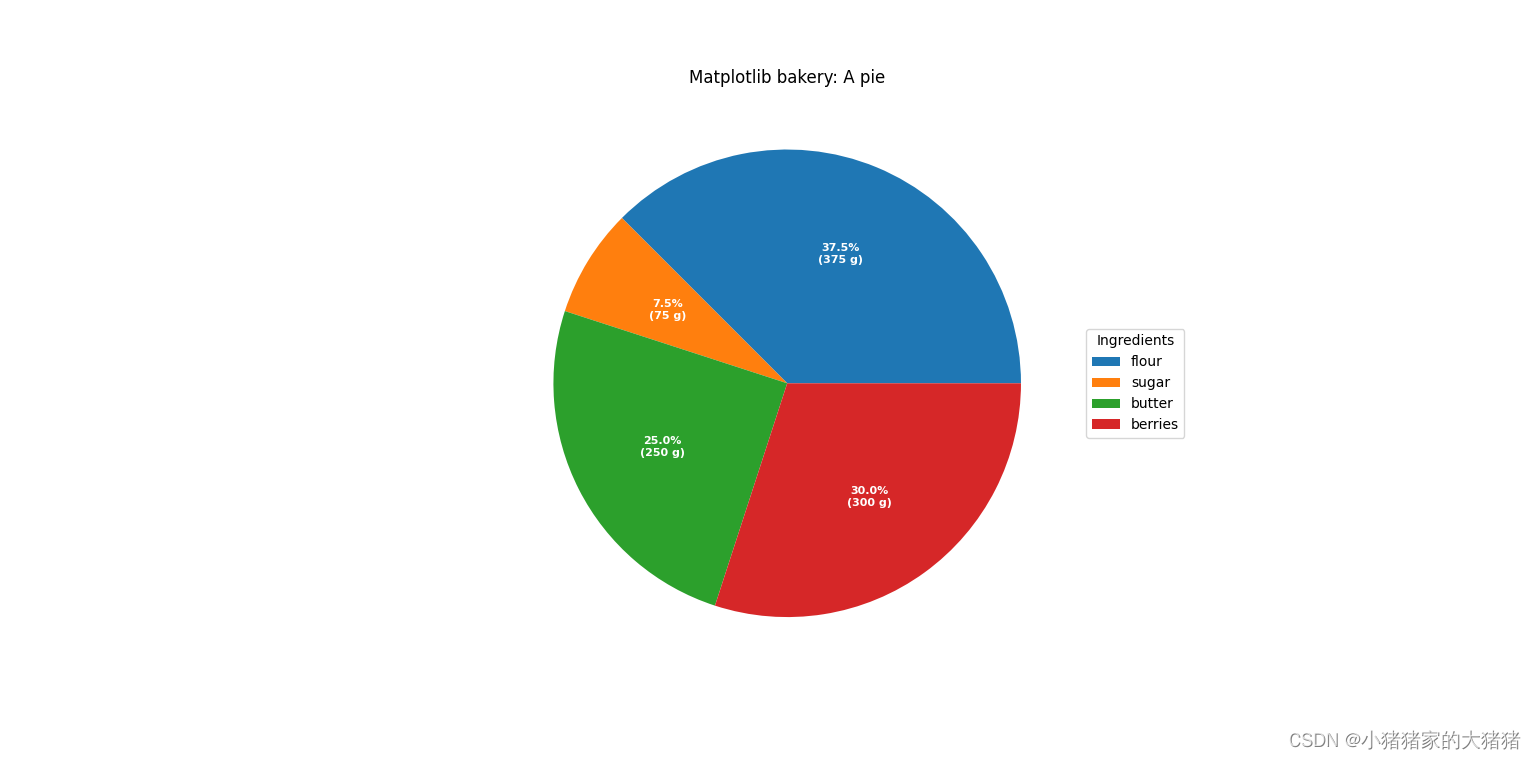
应用
Wedge 类的应用主要集中在饼状图和环状图上,调用 pyplot.pie 函数的时候返回元祖的第一个元素就是 Wedge 对象列表,包含这个饼状图中所有的扇形。通过这个列表,我们可以调用 get_property() 和 set_property() 方法来获取和设置扇形的属性。完整示例代码如下:
import numpy as np
import matplotlib.pyplot as plt

fig, ax = plt.subplots(figsize=(6, 3), subplot_kw=dict(aspect="equal"))

recipe = ["375 g flour",
          "75 g sugar",
          "250 g butter",
          "300 g berries"]

data = [float(x.split()[0]) for x in recipe]
ingredients = [x.split()[-1] for x in recipe]


def func(pct, allvals):
    absolute = int(np.round(pct/100.*np.sum(allvals)))
    return f"{pct:.1f}%\n({absolute:d} g)"

wedges, texts, autotexts = ax.pie(data, autopct=lambda pct: func(pct, data),
                                  textprops=dict(color="w"))

ax.legend(wedges, ingredients,
          title="Ingredients",
          loc="center left",
          bbox_to_anchor=(1, 0, 0.5, 1))

plt.setp(autotexts, size=8, weight="bold")

ax.set_title("Matplotlib bakery: A pie")

plt.show()
画图结果如下
文中难免会出现一些描述不当之处(尽管我已反复检查多次),欢迎在留言区指正,相关的知识点也可进行分享,希望大家都能有所收获!!如果觉得我的文章写得还行,不妨支持一下。你的每一个转发、关注、点赞、评论都是对我最大的支持!


 1239
1239

 被折叠的 条评论
为什么被折叠?
被折叠的 条评论
为什么被折叠?
 到【灌水乐园】发言


