


 本文介绍了土壤质地三角形的概念,它是土壤学中用于描述土壤颗粒组成的一种图形工具。通过Python库pyrolite中的TernaryColorSystems模板,可以生成和分析土壤样本在三角形中的分布,以评估其物理性质如排水性和保水性。此外,还展示了如何用Python代码生成随机土壤数据并投射到三角形上进行可视化。
土壤质地三角形
土壤质地三角形是用于描述土壤中不同粒径颗粒的相对含量的图形工具。这个图形以三个主要颗粒尺寸为基础,它们分别是沙、粉土和黏土。土壤质地三角形的三边分别代表这三种颗粒的百分比含量,形成一个三角形。
在土壤质地三角形中,三个角分别表示100%的沙、粉土和黏土。通过连接这些角,形成的三角形区域表示不同混合比例下的土壤质地。例如,如果一个土壤样品在三角形的中心,那么它包含相等比例的沙、粉土和黏土。如果样品靠近某一边,表示该土壤含有更高比例的对应颗粒。
这种图形有助于农业、土壤科学和土木工程领域的专业人士理解土壤的物理性质。通过了解土壤中各种颗粒的相对含量,可以更好地了解土壤的排水性、通气性、保水性等特性,从而指导相应的土壤管理和土壤改良措施。
pyrolite
这是一个主要用于地球化学领域的python库,地球化学方向的小伙伴可以研究下这个库。网址:pyrolite

这是一些绘图模板,此次土壤质地三角形主要采用Ternary Color Systems模板。

python代码
import matplotlib.pyplot as plt
from pyrolite.util.classification import USDASoilTexture
from pyrolite.util.plot.style import color_ternary_polygons_by_centroid
from pyrolite.util.synthetic import normal_frame

clf = USDASoilTexture()
ax = clf.add_to_axes(ax=None, add_labels=True, figsize=(8, 8))
# color_ternary_polygons_by_centroid(ax)
# plt.show()

color_ternary_polygons_by_centroid(
    ax, colors=("red", "green", "blue"), coefficients=(1, 1, 1), alpha=0.5
)
plt.show()
结果展示:

现在我想随机生成一些土壤组成数据投影到土壤质地三角形中,你也可以使用自己的土壤组成数据进行替换。
import matplotlib.pyplot as plt
import numpy as np
from pyrolite.util.classification import USDASoilTexture
from pyrolite.util.plot.style import color_ternary_polygons_by_centroid
from pyrolite.util.synthetic import normal_frame
import pandas as pd

clf = USDASoilTexture()
ax = clf.add_to_axes(ax=None, add_labels=True, figsize=(8, 8))

# Plot ternary polygons
color_ternary_polygons_by_centroid(ax, colors=("red", "green", "blue"), coefficients=(1, 1, 1), alpha=0.5)

# Create some example data
df = pd.DataFrame(data=np.exp(np.random.rand(100, 3)), columns=['Clay', 'Sand', 'Silt'])

# Project scatter plot onto the ternary diagram
df.pyroplot.scatter(ax=ax, c="yellow", label="Soil Composition", alpha=0.5)

# Show the plot
plt.legend(bbox_to_anchor=(0.8, 1))
plt.show()
结果展示:

mpltern
Mpltern 是一个基于 Matplotlib 的 Python 绘图库,专为三元图设计。文档地址:Mpltern
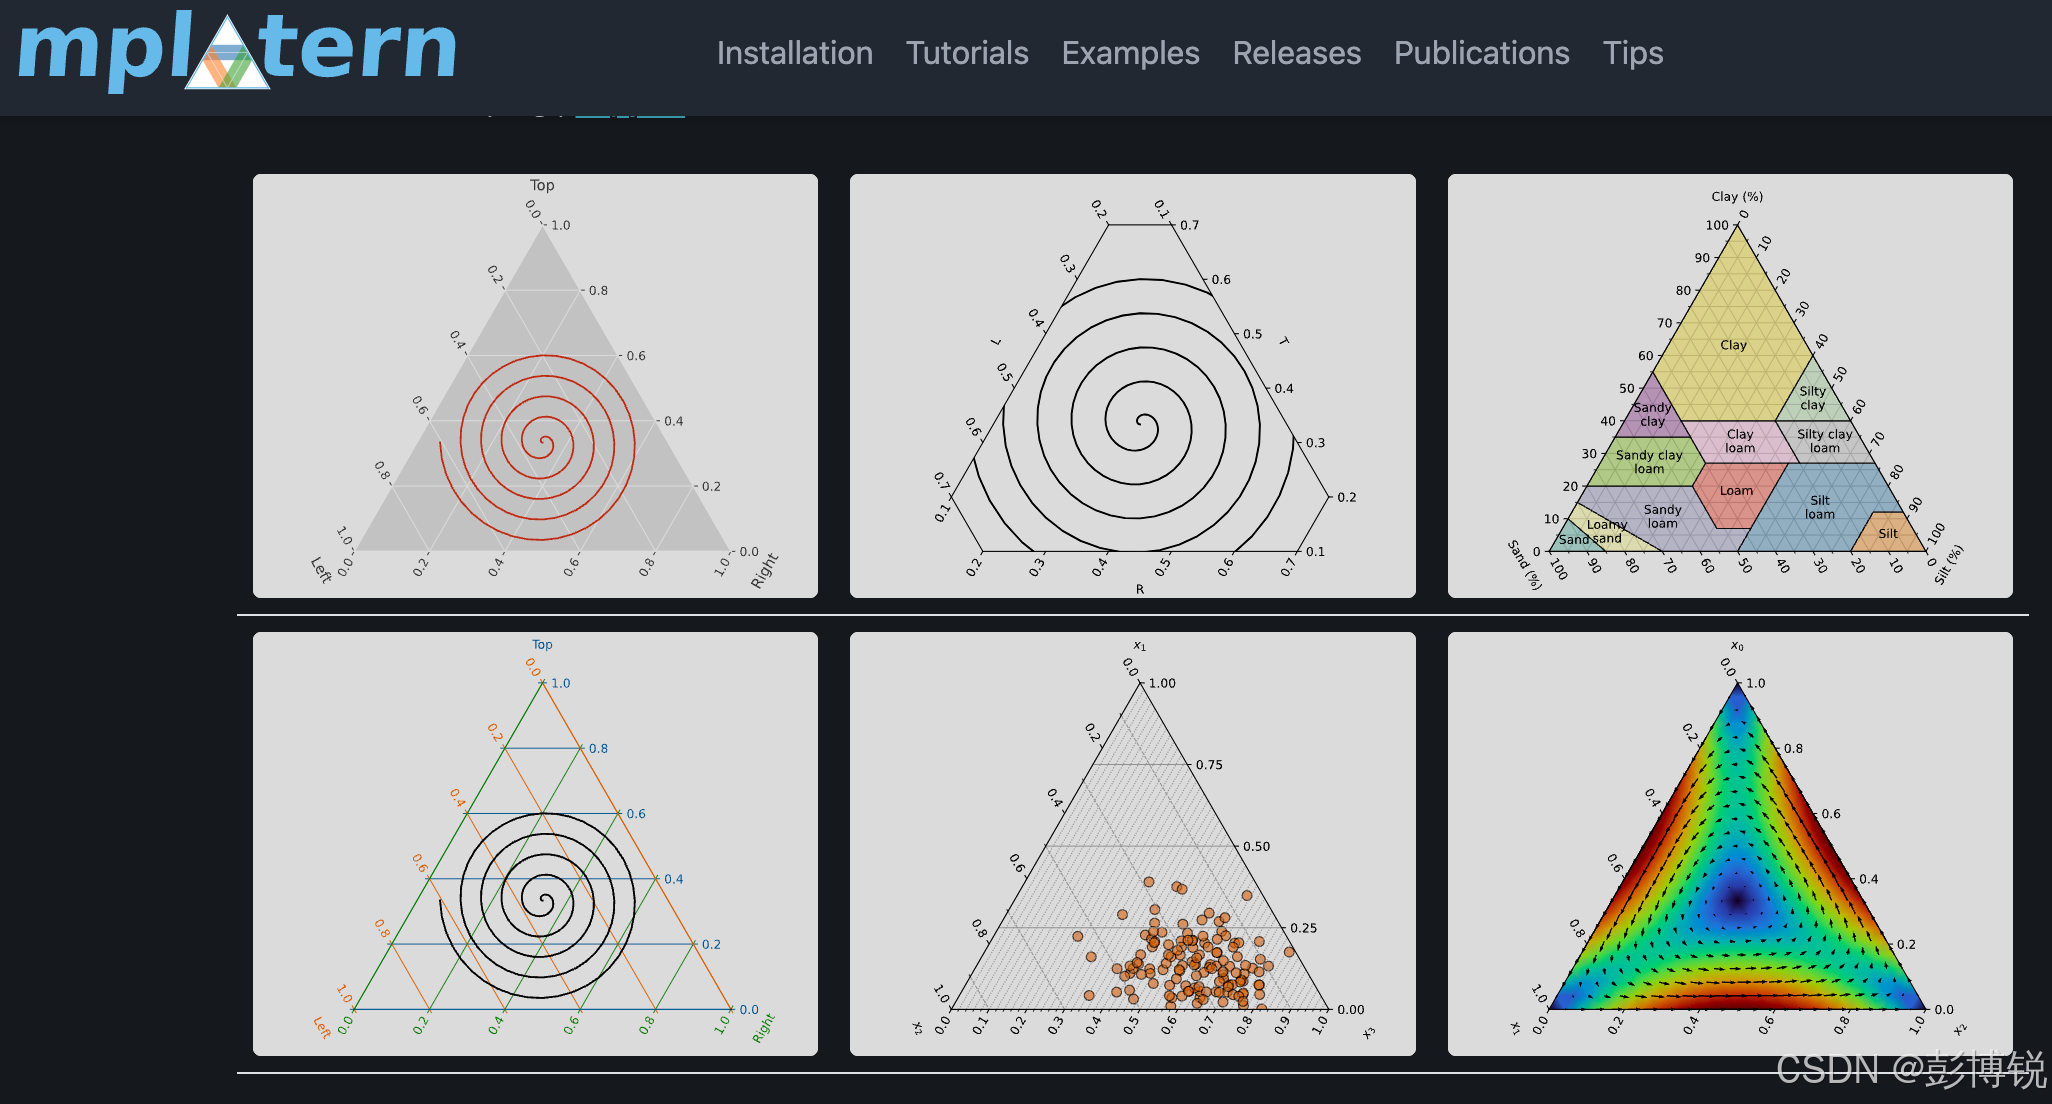
可以看到Mpltern的土壤质地三角形的模板更加好看。
python示例代码:
import numpy as np
import matplotlib.pyplot as plt
from matplotlib.ticker import AutoMinorLocator, MultipleLocator
from matplotlib._cm import _Set3_data
from mpltern.datasets import soil_texture_classes


def calculate_centroid(vertices):
    """Calculte the centroid of a polygon.

    https://en.wikipedia.org/wiki/Centroid#Of_a_polygon

    Parameters
    ----------
    vertices : (n, 2) np.ndarray
        Vertices of a polygon.

    Returns
    -------
    centroid : (2, ) np.ndarray
        Centroid of the polygon.
    """
    roll0 = np.roll(vertices, 0, axis=0)
    roll1 = np.roll(vertices, 1, axis=0)
    cross = np.cross(roll0, roll1)
    area = 0.5 * np.sum(cross)
    return np.sum((roll0 + roll1) * cross[:, None], axis=0) / (6.0 * area)


def plot_soil_texture_classes(ax):
    """Plot soil texture classes."""
    classes = soil_texture_classes

    for (key, value), color in zip(classes.items(), _Set3_data):
        tn0, tn1, tn2 = np.array(value).T
        patch = ax.fill(tn0, tn1, tn2, ec="k", fc=color, alpha=0.6, zorder=2.1)
        centroid = calculate_centroid(patch[0].get_xy())

        # last space replaced with line break
        label = key[::-1].replace(" ", "\n", 1)[::-1].capitalize()

        ax.text(
            centroid[0],
            centroid[1],
            label,
            ha="center",
            va="center",
            transform=ax.transData,
        )

    ax.taxis.set_major_locator(MultipleLocator(10.0))
    ax.laxis.set_major_locator(MultipleLocator(10.0))
    ax.raxis.set_major_locator(MultipleLocator(10.0))

    ax.taxis.set_minor_locator(AutoMinorLocator(2))
    ax.laxis.set_minor_locator(AutoMinorLocator(2))
    ax.raxis.set_minor_locator(AutoMinorLocator(2))

    ax.grid(which="both")

    ax.set_tlabel("Clay (%)")
    ax.set_llabel("Sand (%)")
    ax.set_rlabel("Silt (%)")

    ax.taxis.set_ticks_position("tick2")
    ax.laxis.set_ticks_position("tick2")
    ax.raxis.set_ticks_position("tick2")


def main():
    """Main"""
    ax = plt.subplot(projection="ternary", ternary_sum=100.0)
    plot_soil_texture_classes(ax)
    # add plot here on top of USDA soil texture classes with zorder of e.g. 2.5
    # 添加点投影
    # 假设你有一些点的数据,格式为 [(clay, sand, silt), ...]
    points = [
        (20, 60, 20),  # 第一个点:20%粘土,60%沙子,20%粉砂
        (30, 50, 20),  # 第二个点:30%粘土,50%沙子,20%粉砂
        (40, 30, 30),  # 第三个点:40%粘土,30%沙子,30%粉砂
    ]
     # 将点投影到图上
    clay, sand, silt = np.array(points).T
    ax.scatter(clay, sand, silt, color='red', edgecolor='black', s=50, zorder=2.5)

    # # 在图片下方添加标题
    # plt.figtext(0.5, 0.01, "test1", ha="center", fontsize=12)
    #
    # # 保存高分辨率图片
    # plt.savefig("test1.png", dpi=300)

    plt.show()


if __name__ == "__main__":
    main()
结果展示:


 4030
4030

 被折叠的 条评论
为什么被折叠?
被折叠的 条评论
为什么被折叠?
 到【灌水乐园】发言


