


原文作者:我辈理想
版权声明:文章原创,转载时请务必加上原文超链接、作者信息和本声明。
Cartopy基础入门
【Cartopy】库的安装和瓦片加载(天地图、高德等)
【Cartopy】Geojson数据的加载
【Cartopy】如何更好的确定边界显示
前言
Cartopy的官方文档还是太难读了,来来回回找了很多资料,还是有很多东西无法使用,网络上教程大多比较官方。作为程序员,很多时候还是根据源码来使用各种库来的实在。
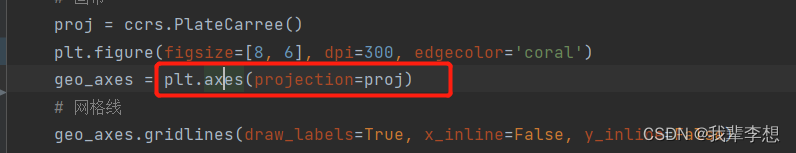
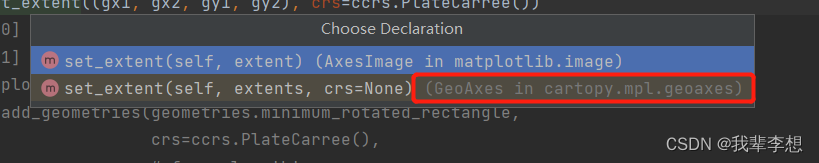
如果看了本站的其他Cartopy文章,就可以看出来,Cartopy是将matplotlib库中的axes重写为GeoAxes,实现了空间类型的数据写入mpl图形,可以参看下面2个图。Geoaxes是特殊的axes对象,能按指定的坐标系统加载绘制不同形式的空间坐标数据。
一、常见用法
set_xlim、set_ylim、set_boundary、set_extent、set_global等方法是常用的设置边界方法,如果上述方法都未设置,plt将根据plt上已画图形自适应(包括所有元素,不包括geom图形)。
set_boundary 方法需要与matplotlib.path.Path一起使用,这个我还没去深入了解。
set_extent的资源消耗其实是小于set_boundary 的。
set_extent和set_global的底层是set_xlim和set_ylim。
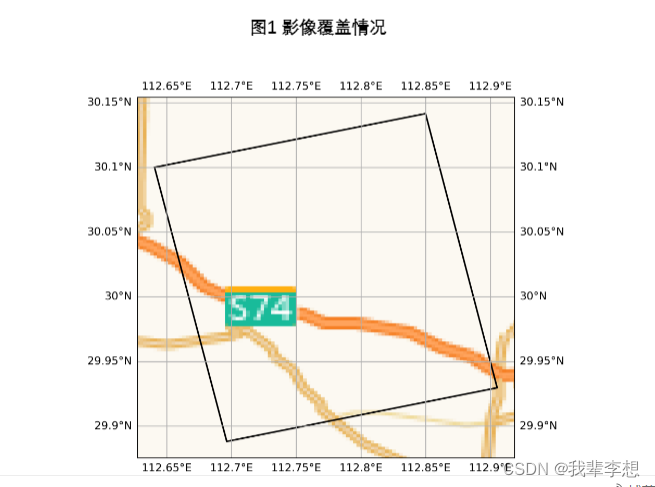
二、实时计算边界
1.计算plt画图边界
这里说的plt画图主要是matplotlib的通过ax.plt等方法展示的图形,可以通过get_extent方法获取边界,并且可以用于set_extent方法。
proj = ccrs.PlateCarree()
plt.figure(figsize=[8, 6], dpi=300, edgecolor='coral')
geo_axes = plt.axes(projection=proj)
# 网格线
geo_axes.gridlines(draw_labels=True, x_inline=False, y_inline=False)
for goe in map_data['pics']:
    x = [pnt[0] for pnt in goe.geom.coords[0]]
    y = [pnt[1] for pnt in goe.geom.coords[0]]
    geo_axes.plot(x, y, transform=ccrs.Geodetic(), color='k')
print('bounds',geo_axes.get_extent(crs=ccrs.PlateCarree()))
geo_axes.set_extent(geo_axes.get_extent(crs=ccrs.PlateCarree()), crs=ccrs.PlateCarree())

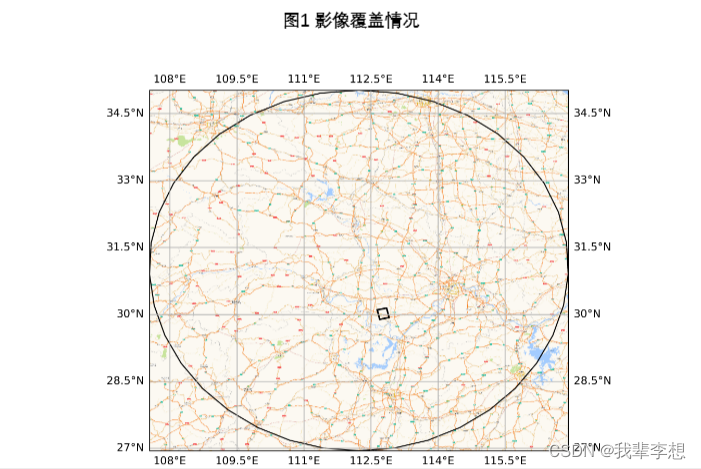
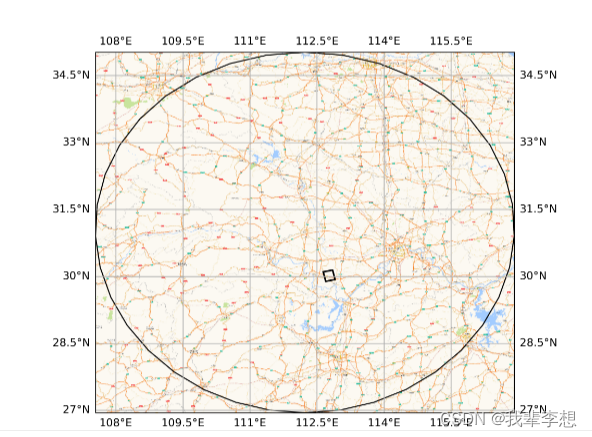
2.计算空间geom图形边界
import cartopy.crs as ccrs
import matplotlib.pyplot as plt
import cartopy.io.img_tiles as cimgt
from shapely.geometry import GeometryCollection, Point, asShape, shape

# 画布
proj = ccrs.PlateCarree()
plt.figure(figsize=[10, 6], dpi=300, edgecolor='coral')
geo_axes = plt.axes(projection=proj)
# 网格线
geo_axes.gridlines(draw_labels=True, x_inline=False, y_inline=False)

geom_json = json.loads(map_data['geom'].geojson)
print('geom_json ', geom_json )
geometries = shape(geom_json)
print('geometries', geometries)
geo_axes.add_geometries(geometries.geoms,
                   crs=ccrs.PlateCarree(),
                   # facecolor='k',
                   # edgecolor='k',
                   linestyle='--')
print('bounds', geometries.bounds)
gx1, gy1, gx2, gy2 = geometries.bounds
geo_axes.set_extent((gx1, gx2, gy1, gy2), crs=ccrs.PlateCarree())

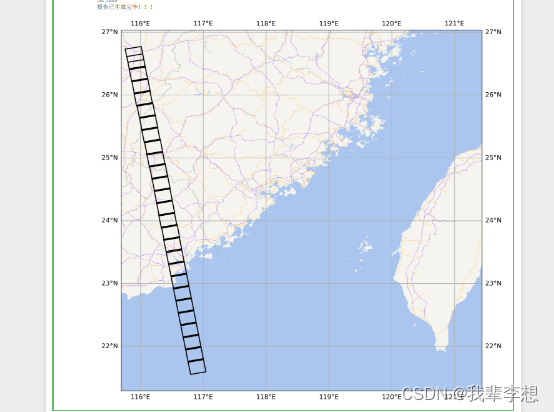
3.2种方式结合的边界
import cartopy.crs as ccrs
import matplotlib.pyplot as plt
import cartopy.io.img_tiles as cimgt
from shapely.geometry import GeometryCollection, Point, asShape, shape

# 画布
proj = ccrs.PlateCarree()
plt.figure(figsize=[10, 6], dpi=300, edgecolor='coral')
geo_axes = plt.axes(projection=proj)
# 网格线
geo_axes.gridlines(draw_labels=True, x_inline=False, y_inline=False)
for goe in map_data['pics']:
    x = [pnt[0] for pnt in goe.geom.coords[0]]
    y = [pnt[1] for pnt in goe.geom.coords[0]]
    geo_axes.plot(x, y, transform=ccrs.Geodetic(), color='k')

geom_json = json.loads(map_data['geom'].geojson)
print('geom_json ', geom_json )
geometries = shape(geom_json)
print('geometries', geometries)
geo_axes.add_geometries(geometries.geoms,
                   crs=ccrs.PlateCarree(),
                   # facecolor='k',
                   # edgecolor='k',
                   linestyle='--')
print('g_bounds', geometries.bounds)
print('p_bounds', geo_axes.get_extent(crs=ccrs.PlateCarree()))
gx1, gy1, gx2, gy2 = geometries.bounds
px1, px2, py1, py2 = geo_axes.get_extent(crs=ccrs.PlateCarree())
bounds = (min(px1, px2, gx1, gx2), max(px1, px2, gx1, gx2), min(py1, py2, gy1, gy2), max(py1, py2, gy1, gy2))
print('gp_bounds', bounds)
geo_axes.set_extent(bounds, crs=ccrs.PlateCarree())

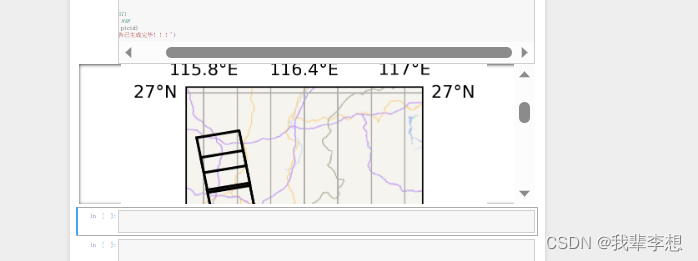
4.限制图形形状
有时为了更好的效果,我们会设定一个图片的形状,使用上述方法还是不能达到我们的目的,这里就需要mtaplotlib的相关功能了,就比如我想要一个正方形的图片,还想要矢量形状与图片边框存在间隔。
# 这个可以将plt标称一个正方形
plt.axis('square')
# 变成正方形后再使用get_extent方法
print('p_bounds', geo_axes.get_extent(crs=ccrs.PlateCarree()))
5.内存泄漏问题
在使用set_extent方法时,如果plt上无任何数据,直接使用set_extent方法,程序将无法结束,最终导致电脑内存爆满,直至电脑崩溃,这是典型的内存泄漏问题。可以通过如下方法规避内存泄漏。
    gx1, gy1, gx2, gy2 = geometries.bounds
    px1, px2, py1, py2 = geo_axes.get_extent(crs=ccrs.PlateCarree())
    if px1 == -180.0 and px2 == 180.0 and py1 == -90.0 and py2 == 90.0:
        print('可能存在内存泄漏')
        geo_axes.set_extent((gx1, gx2, gy1, gy2), crs=ccrs.PlateCarree())
    else:
        bounds = (min(px1, px2, gx1, gx2), max(px1, px2, gx1, gx2),
                  min(py1, py2, gy1, gy2), max(py1, py2, gy1, gy2))
        geo_axes.set_extent(bounds, crs=ccrs.PlateCarree())
   plt.savefig(img_buf)
   plt.clf()


 2296
2296


 被折叠的 条评论
为什么被折叠?
被折叠的 条评论
为什么被折叠?
 到【灌水乐园】发言


