


作者:李雪茸
函数介绍
实现 XGBoost 分类算法使用的是 xgboost 库的 XGBClassifier,具体参数如下:
-
1、max_depth:给定树的深度,默认为3
-
2、learning_rate:每一步迭代的步长,很重要。太大了运行准确率不高,太小了运行速度慢。我们一般使用比默认值小一点,0.1左右就好
-
3、n_estimators:这是生成的最大树的数目,默认为100
-
4、objective:给定损失函数,常用的有:
– reg:linear– 线性回归
– reg:logistic – 逻辑回归
– binary:logistic – 二分类逻辑回归
– binary:logitraw – 二分类逻辑回归
– count:poisson – 计数问题的poisson回归 -
5、booster:给定模型的求解方式,默认为:gbtree;可选参数:gbtree、gblinear,gbtree是采用树的结构来运行数据,而gblinear是基于线性模型
-
6、gamma:指定了节点分裂所需的最小损失函数下降值。这个参数的值越大,算法越保守。范围: [0,∞]
-
7、alpha:L1正则项的权重,推荐的候选值为:[0, 0.01~0.1, 1]
-
8、lambda:L2正则项的权重,推荐的候选值为:[0, 0.1, 0.5, 1]
-
9、num_class:用于设置多分类问题的类别个数
-
10、min_child_weight:指定子节点中最小的样本权重和,如果一个叶子节点的样本权重和小于min_child_weight则拆分过程结束,默认值为1。
-
11、subsample:默认值1,指定采样出 subsample * n_samples 个样本用于训练弱学习器。取值在(0, 1)之间,设置为1表示使用所有数据训练弱学习器。
-
12、colsample_bytree:构建弱学习器时,对特征随机采样的比例,默认值为1
实例
from xgboost import XGBClassifier
from sklearn.datasets import load_iris
from sklearn.datasets import load_breast_cancer
from sklearn import metrics
from sklearn.metrics import accuracy_score
from sklearn.model_selection import train_test_split
from sklearn.metrics import roc_curve, auc
import matplotlib.pyplot as plt
二分类问题
# 举例(二分类)
cancer = load_breast_cancer()
x = cancer.data
y = cancer.target
x_train, x_test, y_train, y_test = train_test_split(x, y, test_size=0.333, random_state=0) # 分训练集和验证集
model = XGBClassifier(max_depth=10,
learning_rate=0.01,
n_estimators=2000,
objective='binary:logistic',
nthread=-1,
gamma=0,
min_child_weight=1,
max_delta_step=0,
subsample=0.85,
colsample_bytree=0.7,
colsample_bylevel=1,
reg_alpha=0,
reg_lambda=1,
scale_pos_weight=1,
seed=1440)
model.fit(x_train, y_train,eval_metric='auc')# 'rmse’:用于回归任务 ;'mlogloss’,用于多分类任务;
# 'error’,用于二分类任务; 'auc’,用于二分类任务
# 对测试集进行预测
y_pred = model.predict(x_test)
predictions = [round(value) for value in y_pred]
#计算准确率
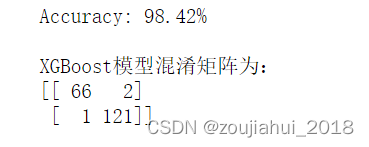
accuracy = accuracy_score(y_test, predictions)
print("Accuracy: %.2f%%" % (accuracy * 100.0))
print(f"\nXGBoost模型混淆矩阵为:\n{metrics.confusion_matrix(y_test,y_pred)}")
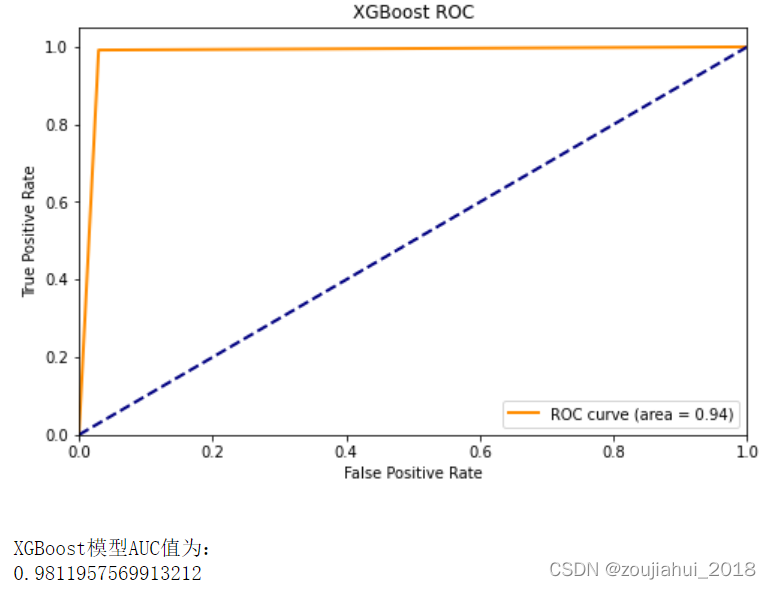
####绘制ROC曲线
fpr1,tpr1,threshold1 = roc_curve(y_test,y_pred)
roc_auc1 = auc(fpr1, tpr1)
lw = 2
plt.figure(figsize=(8, 5))
plt.plot(fpr1, tpr1, color='darkorange',
lw=lw, label='ROC curve (area = %0.2f)' % roc_auc)
plt.plot([0, 1], [0, 1], color='navy', lw=lw, linestyle='--')
plt.xlim([0.0, 1.0])
plt.ylim([0.0, 1.05])
plt.xlabel('False Positive Rate')
plt.ylabel('True Positive Rate')
plt.title('XGBoost ROC')
plt.legend(loc="lower right")
plt.show()
print(f"\nXGBoost模型AUC值为:\n{roc_auc_score(y_test,y_pred)}")
多分类问题
###举例 (多分类)
# 加载样本数据集
iris = load_iris()
X,y = iris.data,iris.target
X_train,X_test,y_train,y_test = train_test_split(X,y,test_size=0.2,random_state=12343)
model = XGBClassifier(
max_depth=3,
learning_rate=0.1,
n_estimators=100, # 使用多少个弱分类器
num_class=3,
booster='gbtree',
gamma=0,
min_child_weight=1,
max_delta_step=0,
subsample=1,
colsample_bytree=1,
reg_alpha=0,
reg_lambda=1,
seed=0 # 随机数种子
)
model.fit(X_train,y_train,eval_metric='mlogloss')# 'rmse’:用于回归任务 ;'mlogloss’,用于多分类任务;
# 'error’,用于二分类任务; 'auc’,用于二分类任务
# 对测试集进行预测
y_pred = model.predict(X_test)
predictions = [round(value) for value in y_pred]
#计算准确率
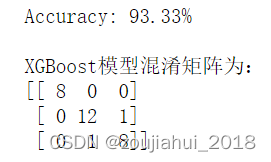
accuracy = accuracy_score(y_test, predictions)
print("Accuracy: %.2f%%" % (accuracy * 100.0))
print(f"\nXGBoost模型混淆矩阵为:\n{metrics.confusion_matrix(y_test,y_pred)}")


 272
272


 被折叠的 条评论
为什么被折叠?
被折叠的 条评论
为什么被折叠?
 到【灌水乐园】发言


