


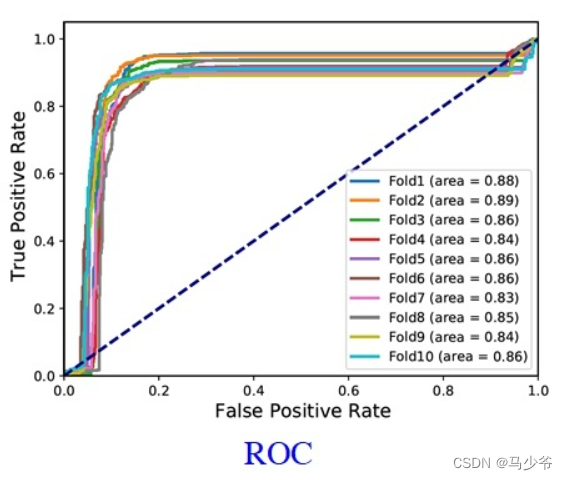
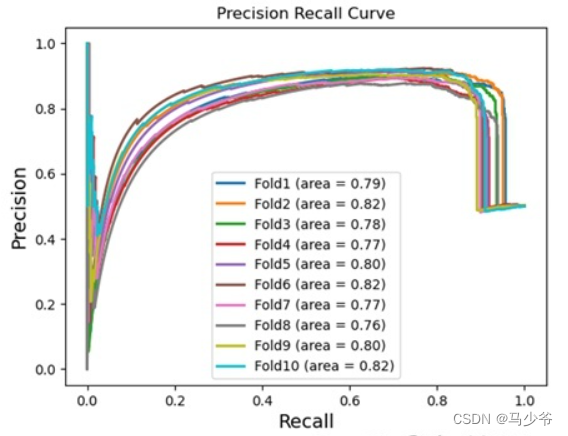
写在前面:AUC和AUPR是模型评估中的两个重要指标。AUC反映了模型的查准率,AUPR反映了模型的查全率。ROC曲线下面积即AUC,PR曲线下面积即AUPR。该文章中使用Python绘制ROC曲线和PR曲线。
1. 数据准备
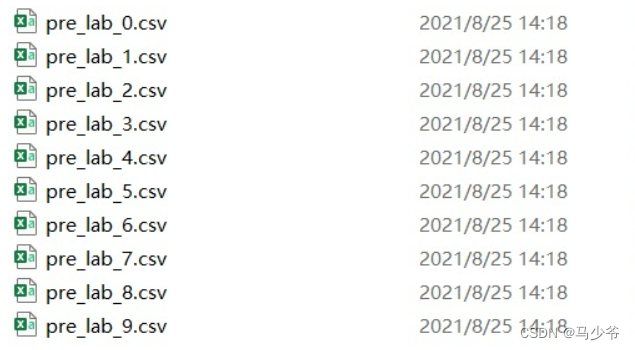
这里使用的是十折交叉验证,所以会有十个文件,同时画曲线时会在同一张图中画十根曲线。如果仅需要画一根曲线,自行修改代码即可。
10个文件:
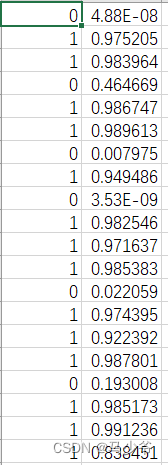
每个文件格式:
2. ROC曲线
auc.py内容如下:
import matplotlib.pyplot as plt
from sklearn.metrics import roc_curve, auc
from sklearn.metrics import roc_auc_score
import csv
import sys
import numpy as np

def ro_curve(y_pred, y_label, figure_file, method_name):
    '''
        y_pred is a list of length n.  (0,1)
        y_label is a list of same length. 0/1
        https://scikit-learn.org/stable/auto_examples/model_selection/plot_roc.html#sphx-glr-auto-examples-model-selection-plot-roc-py
    '''
    y_label = np.array(y_label)
    y_pred = np.array(y_pred)
    fpr = dict()
    tpr = dict()
    roc_auc = dict()
    fpr[0], tpr[0], _ = roc_curve(y_label, y_pred)
    roc_auc[0] = auc(fpr[0], tpr[0])
    lw = 2
    plt.plot(fpr[0], tpr[0],
         lw=lw, label= method_name + ' (area = %0.2f)' % roc_auc[0])
    plt.plot([0, 1], [0, 1], color='navy', lw=lw, linestyle='--')
    plt.xlim([0.0, 1.0])
    plt.ylim([0.0, 1.05])
    # plt.xticks(font="Times New Roman",size=18,weight="bold")
    # plt.yticks(font="Times New Roman",size=18,weight="bold")
    fontsize = 14
    plt.xlabel('False Positive Rate', fontsize = fontsize)
    plt.ylabel('True Positive Rate', fontsize = fontsize)
    #plt.title('Receiver Operating Characteristic Curve', fontsize = fontsize)
    plt.legend(loc="lower right")
    plt.savefig(figure_file + ".pdf")
    return

def col_pic():
    for i in range(10):
        y_label = []
        y_pred = []
        with open("pre_lab_" + str(i) + ".csv") as f:
            f1 = csv.reader(f)
            for line in f1:
                y_label.append(int(float(line[0])))
                # if float(line[1]) > 0.5:
                #     y_pred.append(1)
                # else:
                #     y_pred.append(0)
                y_pred.append(float(line[1]))
            ro_curve(y_pred,y_label,"auc_val_1","Fold" + str(i+1))

def main():
    col_pic()

if __name__=="__main__":
    main()
运行下述命令:
python auc.py
3. PR曲线
aupr.py内容如下:
import matplotlib.pyplot as plt
from sklearn.metrics import precision_recall_curve, average_precision_score
from sklearn.metrics import f1_score
from sklearn.metrics import auc
import csv
import sys
import numpy as np

def ro_curve(y_pred, y_label, figure_file, method_name):
    '''
        y_pred is a list of length n.  (0,1)
        y_label is a list of same length. 0/1
        https://scikit-learn.org/stable/auto_examples/model_selection/plot_roc.html#sphx-glr-auto-examples-model-selection-plot-roc-py
    '''
    y_label = np.array(y_label)
    y_pred = np.array(y_pred)
    # fpr = dict()
    # tpr = dict()
    # roc_auc = dict()
    # fpr[0], tpr[0], _ = precision_recall_curve(y_label, y_pred)
    # roc_auc[0] = auc(fpr[0], tpr[0])
    # lw = 2
    # plt.plot(fpr[0], tpr[0],
    #      lw=lw, label= method_name + ' (area = %0.2f)' % roc_auc[0])
    # plt.plot([0, 1], [0, 1], color='navy', lw=lw, linestyle='--')
    # plt.xlim([0.0, 1.0])
    # plt.ylim([0.0, 1.05])
    # fontsize = 14
    # plt.xlabel('Recall', fontsize = fontsize)
    # plt.ylabel('Precision', fontsize = fontsize)
    # plt.title('Precision Recall Curve')
    # plt.legend(loc="lower right")
    # plt.savefig(figure_file)
    lr_precision, lr_recall, _ = precision_recall_curve(y_label, y_pred)
#   plt.plot([0,1], [no_skill, no_skill], linestyle='--')
    plt.plot(lr_recall, lr_precision, lw = 2, label= method_name + ' (area = %0.2f)' % average_precision_score(y_label, y_pred))
    fontsize = 14
    plt.xlabel('Recall', fontsize = fontsize)
    plt.ylabel('Precision', fontsize = fontsize)
    plt.title('Precision Recall Curve')
    plt.legend()
    plt.savefig(figure_file)
    return

def col_pic():
    for i in range(10):
        y_label = []
        y_pred = []
        with open("pre_lab_" + str(i) + ".csv") as f:
            f1 = csv.reader(f)
            for line in f1:
                y_label.append(float(line[0]))
                # if float(line[1]) > 0.5:
                #     y_pred.append(1)
                # else:
                #     y_pred.append(0)
                y_pred.append(float(line[1]))
            ro_curve(y_pred,y_label,"aupr_val_1","Fold" + str(i+1))

def main():
    col_pic()

if __name__=="__main__":
    main()
运行下述命令:
python aupr.py
参考文献:Python绘制ROC曲线和PR曲线


 8055
8055

 被折叠的 条评论
为什么被折叠?
被折叠的 条评论
为什么被折叠?
 到【灌水乐园】发言


