


## 1.设置当前工作目录
setwd("./pheatmap/")## 2.安装和导入R包
install.packages("pheatmap")
library(pheatmap)
## 3.R包:pheatmap简要信息
# Package: pheatmap
# Type: Package
# Title: Pretty Heatmaps
# Version: 1.0.12
# Date: 2018-12-26
# Author: Raivo Kolde
# Maintainer: Raivo Kolde <rkolde@gmail.com>
#   Depends: R (>= 2.0)
# Description: Implementation of heatmaps that offers more control
# over dimensions and appearance.
# Imports: grid, RColorBrewer, scales, gtable, stats, grDevices, graphics
# License: GPL-2
# LazyLoad: yes
# RoxygenNote: 6.0.1
# NeedsCompilation: no
# Packaged: 2019-01-02 15:37:50 UTC; kolde
# Repository: CRAN
# Date/Publication: 2019-01-04 13:50:12 UTC
# Built: R 3.6.0; ; 2019-05-04 02:53:49 UTC; windows

#@ 主要函数
ls(package:pheatmap)
# [1] "pheatmap"
## 4.绘制简单的热图
#@ 导入R内置数据集:mtcars
data("mtcars")#@ 查看前6行数据
head(mtcars)
# mpg cyl disp  hp drat    wt  qsec vs am gear
# Mazda RX4         21.0   6  160 110 3.90 2.620 16.46  0  1    4
# Mazda RX4 Wag     21.0   6  160 110 3.90 2.875 17.02  0  1    4
# Datsun 710        22.8   4  108  93 3.85 2.320 18.61  1  1    4
# Hornet 4 Drive    21.4   6  258 110 3.08 3.215 19.44  1  0    3
# Hornet Sportabout 18.7   8  360 175 3.15 3.440 17.02  0  0    3
# Valiant           18.1   6  225 105 2.76 3.460 20.22  1  0    3
# carb
# Mazda RX4            4
# Mazda RX4 Wag        4
# Datsun 710           1
# Hornet 4 Drive       1
# Hornet Sportabout    2
# Valiant              1
#@ 绘制热图
pheatmap::pheatmap(mtcars,
                   cluster_rows = T,
                   show_rownames = T,
                   show_colnames = T,
                   color = colorRampPalette(c("blue", "lightblue", "red"), bias = 1)(500),
                   border_color = NA,
                   cellwidth = 30,
                   cellheight = 12,
                   fontsize_col = 18,
                   fontsize_row = 10,
                   scale = "row")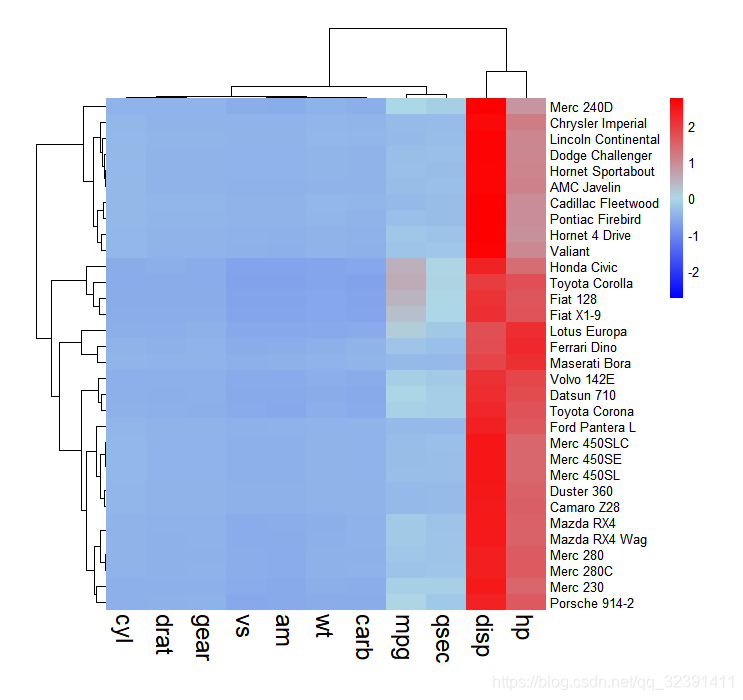
## 5.结束
sessionInfo()
# R version 3.6.2 (2019-12-12)
# Platform: x86_64-w64-mingw32/x64 (64-bit)
# Running under: Windows 10 x64 (build 18363)
#
# Matrix products: default
#
# locale:
# [1] LC_COLLATE=Chinese (Simplified)_China.936
# [2] LC_CTYPE=Chinese (Simplified)_China.936
# [3] LC_MONETARY=Chinese (Simplified)_China.936
# [4] LC_NUMERIC=C
# [5] LC_TIME=Chinese (Simplified)_China.936
#
# attached base packages:
# [1] stats     graphics  grDevices utils     datasets  methods
# [7] base
#
# other attached packages:
# [1] pheatmap_1.0.12 vioplot_0.3.4   zoo_1.8-7
# [4] sm_2.2-5.6
#
# loaded via a namespace (and not attached):
# [1] lattice_0.20-38    packrat_0.5.0      grid_3.6.2
# [4] R6_2.4.1           lifecycle_0.1.0    gtable_0.3.0
# [7] scales_1.1.0       rlang_0.4.4        RColorBrewer_1.1-2
# [10] tools_3.6.2        munsell_0.5.0      compiler_3.6.2
# [13] colorspace_1.4-1   tcltk_3.6.2


 7万+
7万+


 被折叠的 条评论
为什么被折叠?
被折叠的 条评论
为什么被折叠?
 到【灌水乐园】发言


