


目录
GPU workload distribution | GPU工作负载分配
Lack of work limited occupancy | 受工作不饱和限制的占用率
Launch rate limited occupancy | 启动速率限制的占用率
Reading the limiters graph | 解读限制因素图表
Peak occupancy does not always mean peak | performance 高占用率并不总是意味着高性能
If you’re working with GPUs, chances are you’ve heard the term occupancy thrown around in the context of shader performance. You might have heard it helps hiding memory latency but are not sure exactly what that means. If that’s the case, then you are exactly where you should be! In this blog post we will try to demystify what exactly this metric is. We will first talk a bit about the hardware architecture to understand where this metric is coming from. We will then explain the factors that can limit occupancy both statically at compile time and dynamically at run time. We will also help you identify occupancy-limited workloads using tools like the Radeon™ GPU Profiler and offer potential leads to alleviate the issues. Finally, the last section will try to summarize all the concepts touched upon in this post and offer practical solutions to practical problems.
This article however assumes you have a basic understanding of how to work with a GPU. Mainly, we expect you to know how to use the GPU from a graphics API perspective (draws, dispatches, barriers etc.) and that the workloads are executed in groups of threads on the GPU. We also expect you to know about the basic resources a shader uses like the scalar registers, vector registers, and shared memory.
如果你正在使用GPU,很有可能你听过着色器性能方面的相关术语"occupancy"。你可能听说它有助于隐藏内存 latency ,但不确定具体意味着什么。如果是这样,那么你来对地方了!在这篇博文中,我们将试图揭开"occupancy"这个度量标准的神秘面纱。我们首先会简要介绍硬件架构,以了解这个度量标准的来源。然后我们将解释在编译时和运行时会限制occupancy的因素。我们还将帮助你使用Radeon™ GPU Profiler等工具识别受occupancy限制的workload,并提供缓解问题的潜在线索。最后,最后一节将总结本文涉及的所有概念,并针对实际问题提供实用解决方案。
然而,本文假设你对如何使用GPU有基本的了解。主要地,我们希望你知道如何从图形API的角度使用GPU(draws绘制、dispatches分派、barriers屏障等),并且一个工作负载(workload)在GPU上以线程组的形式执行。我们还希望你了解着色器使用的资源,如标量寄存器、向量寄存器和共享内存。(备注:workload是一个完整的计算任务,比如说让GPU去渲染一帧图像)
GPU workload distribution | GPU工作负载分配
To understand the concept of occupancy we need to remember how the GPU distributes work. From the architecture of the hardware, we know that the computing power of the GPU lies in the Single Instruction Multiple Data (SIMD) units. The SIMDs are where all the computation and memory accesses in your shader are processed. Because the SIMD datapaths in AMD RDNA™-based GPUs are 32-wide, the GPU executes workloads in groups of at least 32 threads, which we call a wavefront, or wave for short. For any given overall workload size, the GPU will break it into wavefronts and dispatch them to the available SIMDs. There will often be more wavefronts to run than available SIMDs, which is fine because each SIMD can have multiple wavefronts assigned to it. From now on, we will refer to the action of assigning a wave to a SIMD as launching a wave. In RDNA1, each SIMD has 20 slots available for assigned wavefronts, and RDNA 2 and RDNA 3 have 16 slots per SIMD.
为了理解occupancy的概念,我们需要记住GPU如何分配workload的。从硬件的架构上来说,我们知道GPU的计算能力存在于单指令多数据(SIMD)单元中。SIMD是处理着色器中所有计算和内存访问的地方。由于基于AMD RDNA™架构的GPU的SIMD数据通路是32宽度的,GPU以至少32个线程一组的形式执行workload,我们称之为一个wavefront或简称为wave。对于给定大小的workload,GPU会将其拆分成若干个wavefront,并将这些wavefront派发到可用的SIMD上。通常情况下,会有多个待运行的wavefront,而可用的SIMD可能不足,这是正常的,因为每个SIMD可以分配多个wavefront。从现在开始,我们将把“将wave分配给SIMD”的行为称为"启动一个wave(launching a wave)"。在RDNA1架构中,每个SIMD有20个slot 用于分配wavefront,而RDNA 2和RDNA 3则每个SIMD有16个slot。
(笔记:wavefront 类似于 NVIDIA 的 warp,都是调度和执行的基本单位。每个 wavefront 包含多个线程,通常是32个。这些线程在同一个指令下同步执行,也就是说,同一个 wavefront 中的线程会执行相同的指令,但处理不同的数据(Single Instruction Multiple Data (SIMD),单指令多数据架构))
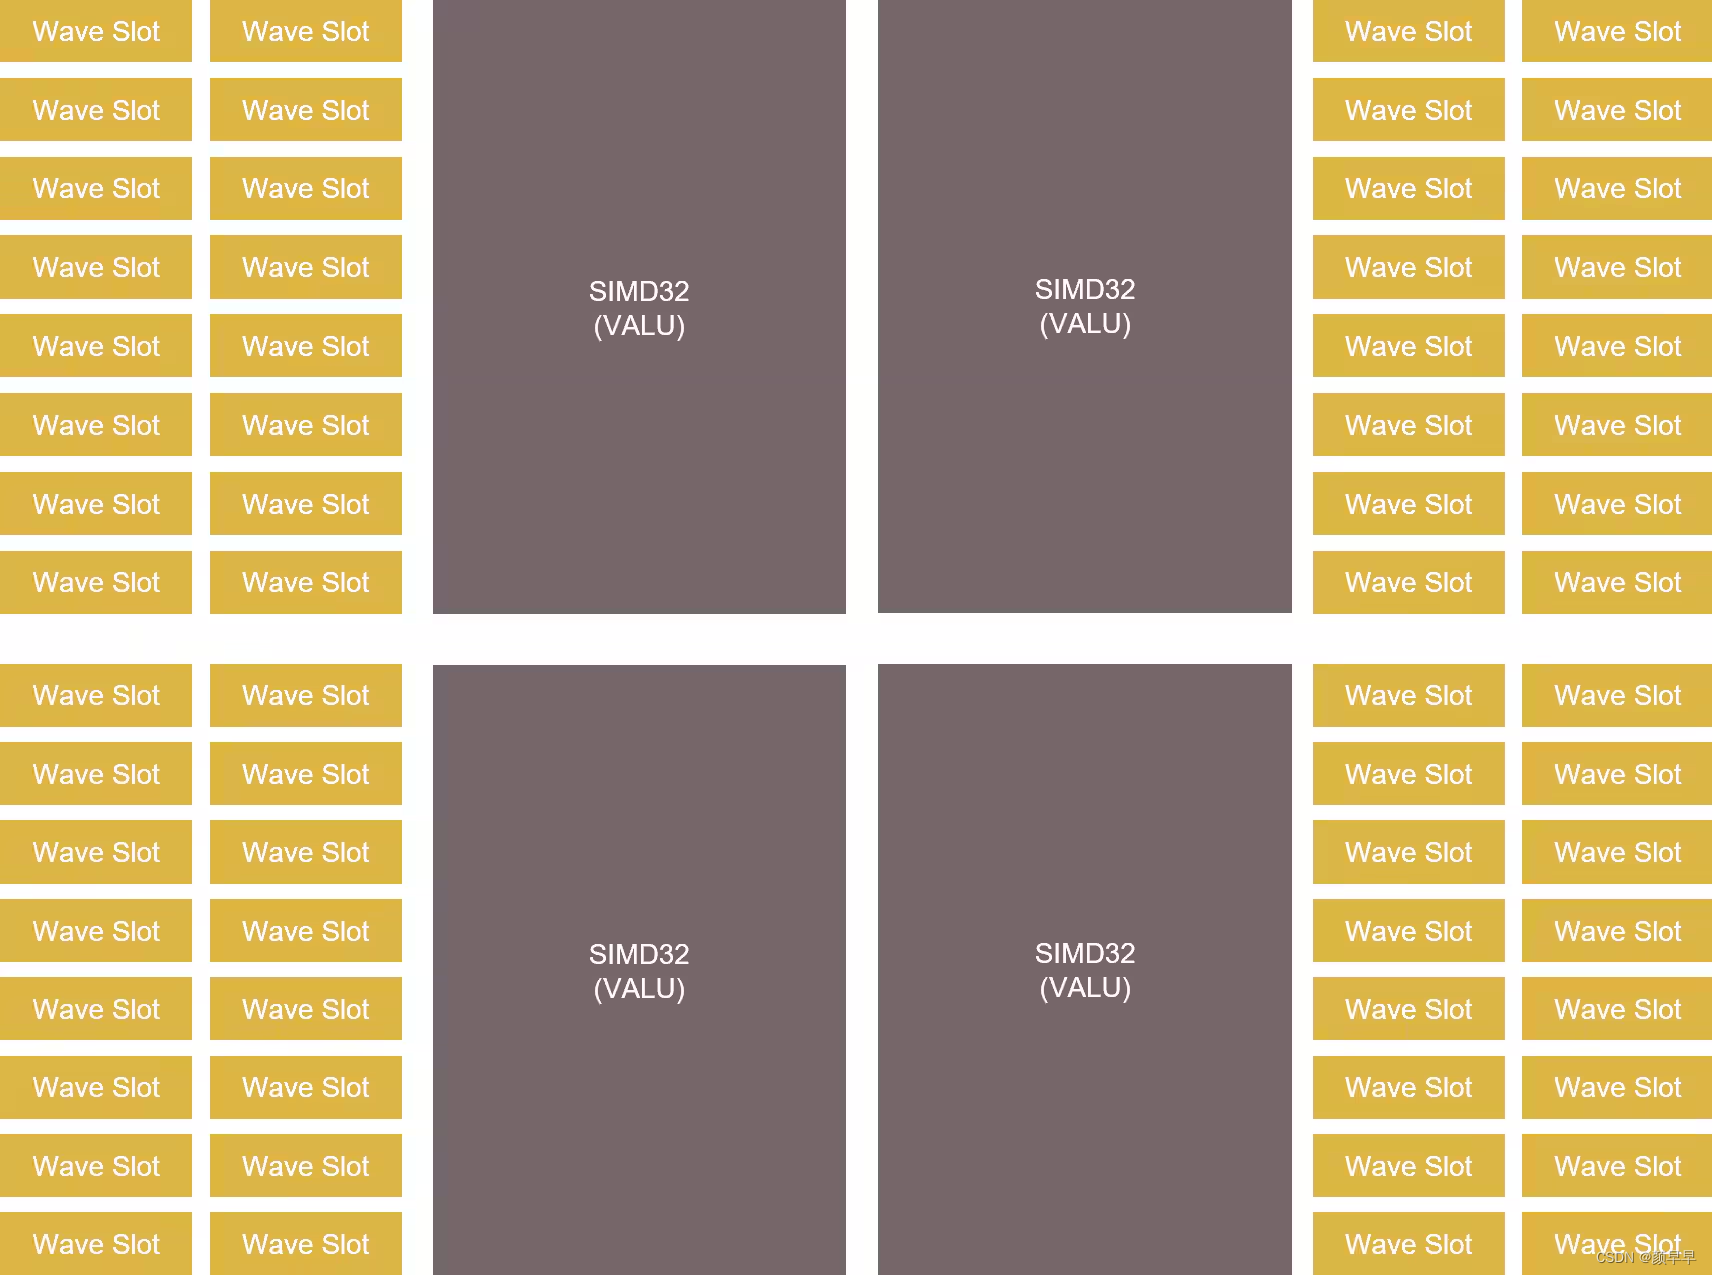
A visual representation of the wave slots for a single Work Group Processor
单个工作组处理器的wave slots 的可视化表示
While multiple wavefronts can be assigned to a single SIMD, only one wavefront can be executed at a time on this SIMD. However, the assigned wavefronts don’t have to be executed in order and they don’t have to be fully executed in one go either. This means that the GPU is free to execute any assigned wavefront on a given SIMD and can do so cycle-by-cycle, switching between them as needed, as they execute.
It makes that possible by knowing what each shader is doing by tracking wavefront execution, giving it a view of what’s currently running, what resources are being used and are available, and knowing what could run next. Its main job by doing that is to hide memory latency, because accessing external memory in a shader is costly and can take hundreds of clock cycles if the access is not cached. Rather than pause the running wavefront and wait for any memory access, cached or not, because it’s managing multiple assigned wavefronts it can pick and start another one in the meantime.
Let’s take an example, wavefront A is picked up by the SIMD, starts running some ALU computations and at some point, needs to fetch data from memory (e.g. sample a texture). Depending on how recently this data was accessed, the request might go through the entire cache hierarchy, go into memory, and finally come back. This might take up to a few 100s of cycles and without multiple wavefronts in flight, the SIMD would just wait for the data to come back. With multiple wavefronts in flight, instead of waiting for the results to come back, the GPU can simply switch to a different wavefront, let’s say wavefront B, and execute it. Hopefully, wavefront B starts by doing some ALU computations before requiring itself data from memory. All those cycles spent on running ALU computations from wavefront B are hiding the latency of fetching data for wavefront A. If there are enough wavefronts in flight which have ALU operations to execute, it is possible for the SIMD to never be idle.
尽管可以将多个wavefront分配给单个SIMD,但在一个SIMD上一次只能执行一个wavefront。然而,分配的这些wavefront不必按顺序执行,也不需要连续地执行完一个wavefront的所有指令。这意味着GPU可以自由地在给定的SIMD上执行任何已分配的wavefront,并且在执行过程中逐周期地切换不同wavefront。
通过跟踪wavefront的执行,GPU可以知道每个着色器正在进行的操作,知道当前正在运行的内容、正在使用和可用的资源,并知道接下来可以运行什么。这么设计的主要目的是隐藏内存 latency ,因为在着色器中访问外部内存是昂贵的,如果内存访问的数据没有在缓存中找到,就需要从主存(外部内存)中获取数据,这可能需要数百个时钟周期。无论所需的数据是否已经被缓存,GPU都可以选择启动另一个wavefront,执行另一个任务,而不是暂停等待内存访问的完成。
让我们举个例子,GPU在一个SIMD选中了一个wavefront A,开始执行一些ALU计算,执行的过程中wavefront A需要从内存中获取数据(例如对纹理进行采样)。根据最近是否访问过这个数据,这个需求可能会经过整个缓存层次结构,最终到达主内存(memory)然后才返回,这个过程可能需要数百个时钟周期,如果这个SIMD单元中没有其他wavefront在运行,那这个SIMD单元只能等待wavefront A的数据返回,期间会处于空闲状态,浪费计算资源。然而,如果有多个正在执行的wavefront,GPU可以在wavefront A等待数据的时候,立即切换到另一个wavefront,比如wavefront B,并开始执行wavefront B的任务。最好的情况就是wavefront B刚好需要先执行一些ALU计算然后再去在内存中获取数据。这样一来,wavefront B花费的在执行ALU计算的时间正好可以隐藏wavefront A为了获取数据而带来的等待时间,称为隐藏了这个latency,称为隐藏了这个latency 。如果有SIMD中有足够多的wavefront交替运行执行ALU计算和内存访问操作,这个SIMD单元就可以始终有活干,几乎不会空闲,没有算力浪费。
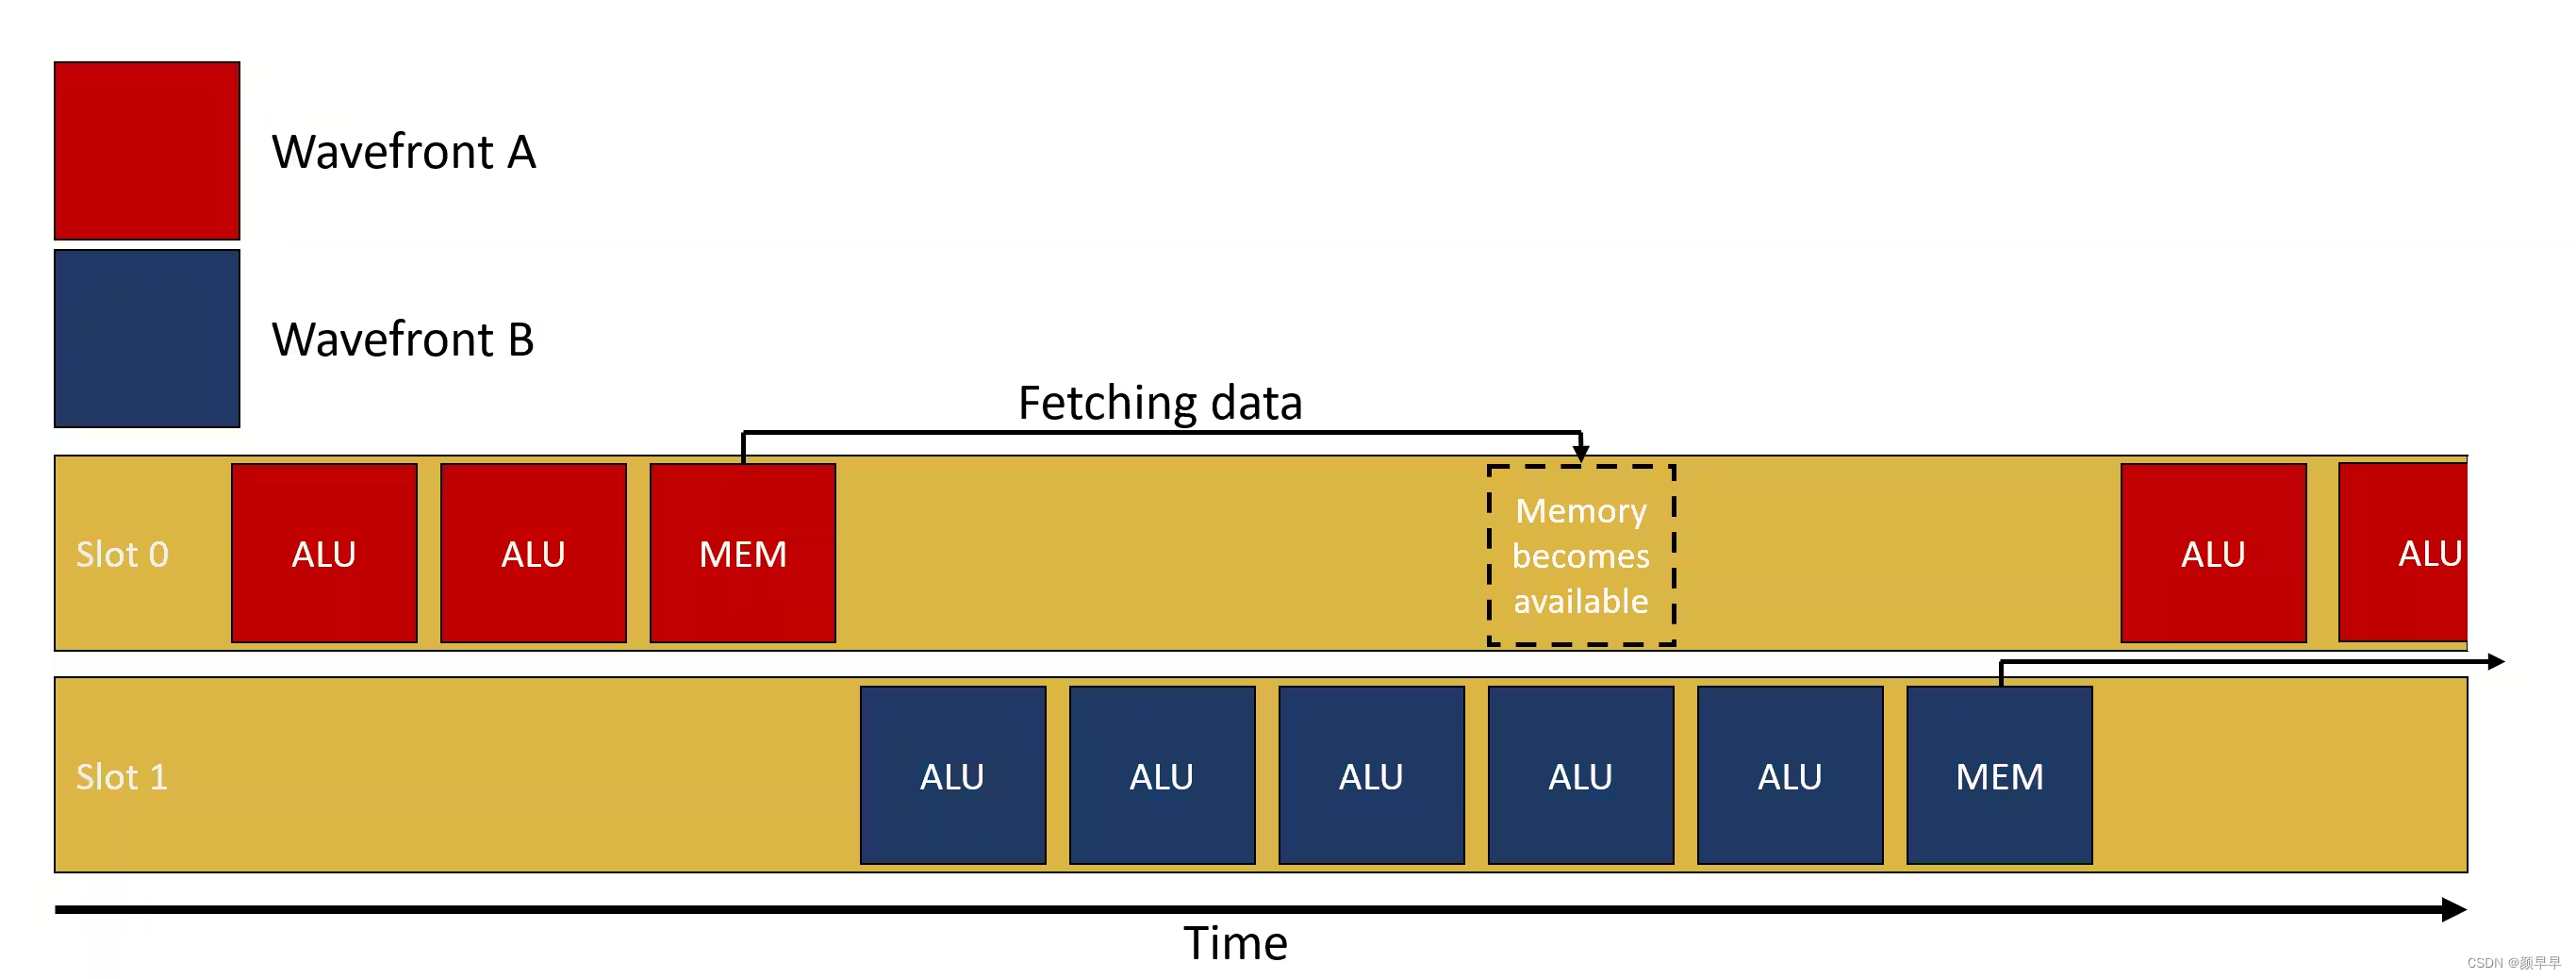
A visual representation of the above example
上述示例的可视化表示
One way to visualize the impact of latency hiding is to use the Radeon GPU Profiler (RGP) and inspect the instruction timings of a single draw or dispatch. In the following image, we’re looking at the instructions executed by the GPU. In the latency column we can see for each instruction how many clocks it took to execute. If we look at instruction 435, we can see that it took about 8.5 million clocks in total. Because it’s a memory wait instruction, we want to spend as little time as possible actually stalled waiting and instead hide that latency by switching to a different wavefront. This is exactly what the color coding is showing us. The first part of the bar, of which about 80% is colored green, means that about 80% of the overall time spent waiting was actually hidden by executing vector ALU operations from different wavefronts instead. We can also see that at the beginning of the green bar there are some yellow hatching lines, meaning scalar ALU operations were also executed in parallel to those vector ALU operations.
Radeon GPU Profiler (RGP) 可以看 latency hiding 的影响,并检查单个绘制或调度的指令时序。在下面的图像中,我们正在查看GPU执行的指令。在 latency 列中,我们可以看到每个指令执行所需的时钟数(clk)。如果我们看一下指令435,我们可以看到它总共花费了大约850万个时钟周期。因为它是一个内存等待指令,我们希望实际上在阻塞在等待上的时间尽可能少,并通过切换到其他的wavefront来隐藏这种 latency 。这正是颜色编码向我们展示的。条形图的第一部分大约80%为绿色,意味着大约80%的等待时间实际上是通过执行来其他wavefront的VALU(矢量算数逻辑单元)操作来隐藏的。我们还可以看到在绿色条形图的开头有一些黄色的斜线,意味着在执行这些VALU操作的同时,还执行了一些SALU(标量算数逻辑单元操作)。
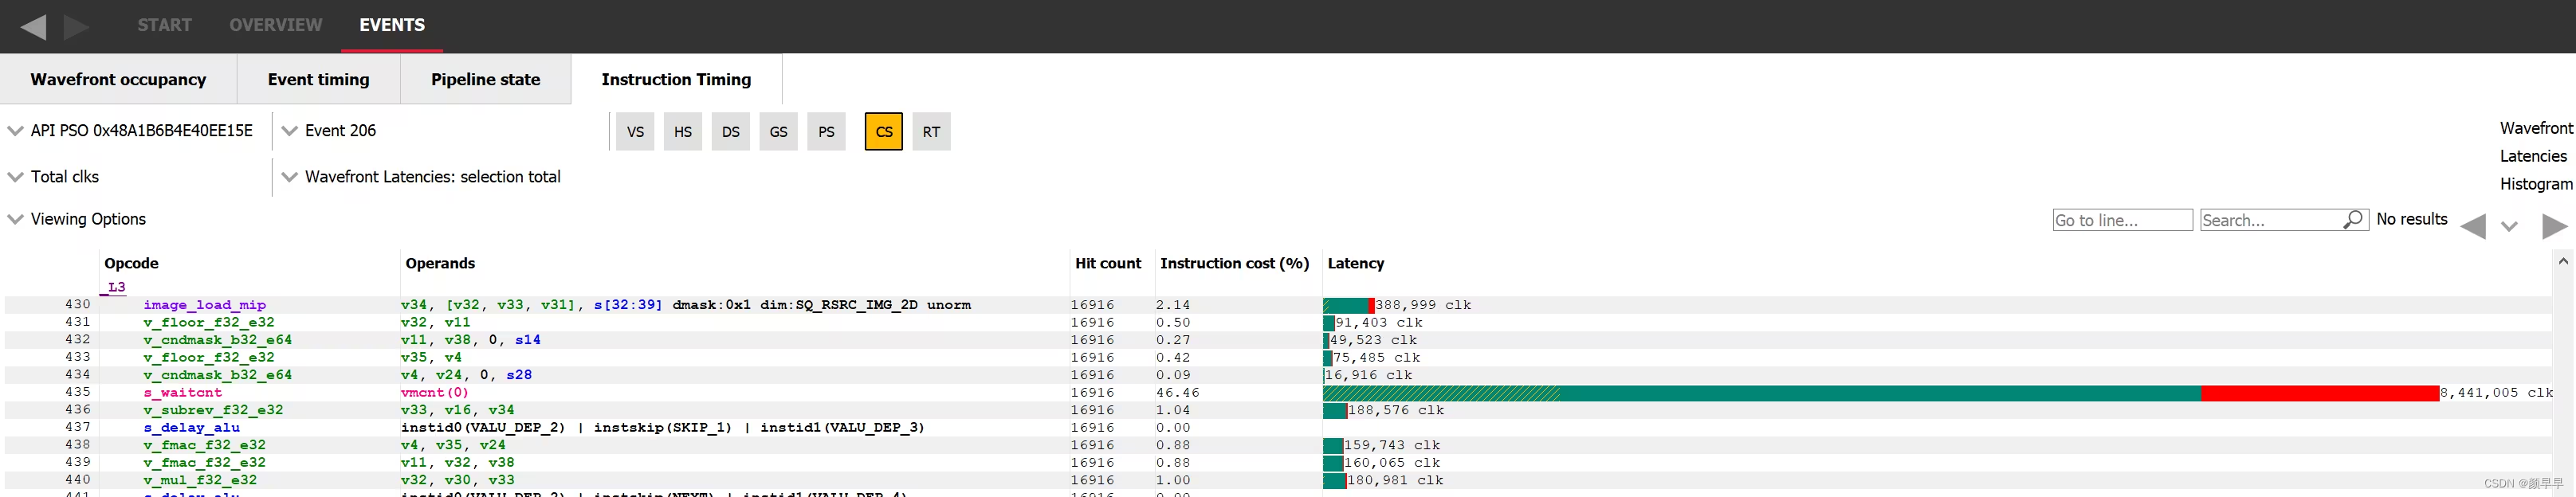
Latency hiding visualisation in the intruction timing tab of RGP
RGP中指令时序选项卡中的 latency 隐藏可视化
On a side note, this tab also shows the repartition of the length of the analyzed wavefronts as a histogram. This visualization helps you realize that the execution length of different wavefronts can and does vary greatly within a single workload. It is also possible to isolate some wavefronts for instruction timing analysis by selecting a region of the histogram using the widget directly underneath it.
顺便提一下,该选项卡还显示了分析的wavefront长度的分布直方图。这种可视化有助于您意识到即使同一个workload内部,不同wavefront的执行时长可以有很大的差异。还可以通过使用直方图下方的滑动部件选择直方图的某个区域,将一些wavefront隔离出来进行 instruction timing 分析。
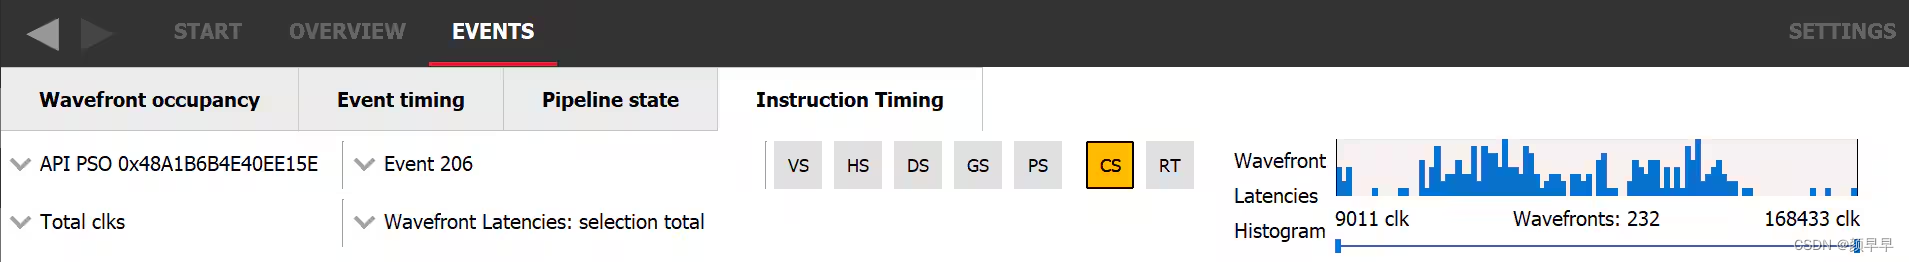
The wavefront latency histogram from RGP/RGP中的wavefront latency 直方图
This wavefront switching mechanism only works if the GPU is able to switch the running wavefront quickly; the overhead of switching must be lower than the potential time the SIMD would spend idle. To switch swiftly, all of the resources that the wavefronts need are made available at all times. That way, when switching to a different wavefront, the GPU can immediately access the required resources for it to run.
这种wavefront切换机制只有在GPU能够快速切换正在运行的wavefront时才能发挥作用;切换的开销必须小于SIMD可能空闲的时间。为了快速切换,所有wavefront需要的资源必须始终可用。这样,当切换到另一个wavefront时,GPU可以立即访问到它当下需要的资源。
Occupancy definition| 占用率定义
Occupancy is the ratio of assigned wavefronts to the maximum available slots. In RDNA2 onwards, for a single SIMD, this means the number of assigned wavefronts divided by 16. Let’s take an example, if a SIMD has 4 wavefronts in flight, the occupancy is 4 / 16 = 25%. A different interpretation of occupancy is the capacity of the SIMD to hide latency. If the occupancy is 1 / 16, it means that if the wavefront has to wait for something, the latency cannot be hidden at all since no other wavefront is assigned to this SIMD. On the other end of the spectrum, if a SIMD has an occupancy of 16 / 16, it is in good position to hide latency.
Before diving deeper into occupancy, now might be a good time to get some intuition on when latency hiding, and thus occupancy, correlates with performance. Since increasing occupancy means increasing the latency hiding capacity of the GPU, a workload that is not latency bound will not benefit from increased occupancy. An example of this would be an ALU bound workload. We don’t need to increase the number of available waves per SIMD if it is already running at 100% utilization and not spending any time waiting for something.
If we put it the other way around, the only workloads that might benefit from increased occupancy are the ones latency bound. Most workloads will follow the following pattern: load data, do some ALU work on it, store data. So a workload that could benefit from adding some more waves would be one where the number of waves multiplied by the time it takes to run the ALU work is lower than the time it takes to load the data. With more waves in flight, we increase the amount of overall ALU work available to hide the latency from loading the data.
That being said, occupancy is not a silver bullet and can also decrease performance. In heavily memory bound scenarios, increasing the occupancy might not help, especially if very little work is being done between the load and store operations. If the shader is already memory bound, increasing the occupancy will result in more cache trashing and will not help hide the latency. As always, this is a balancing act.
Occupancy是已分配的wavefront数量与最大可用slot之间的比率。从RDNA2开始,对于单个SIMD,Occupancy = 已分配的wavefront数量除以16。举个例子,如果一个SIMD中有4个正在运行的wavefront,那么Occupancy就是4 / 16 = 25%。所以Occupancy也可以解释为SIMD隐藏latency 的能力:如果occupancy是1 / 16,这意味着如果wavefront必须等待某些内容, latency 将无法被隐藏,因为没有其他wavefront被分配给这个SIMD。另一方面,如果一个SIMD的occupancy是16 / 16,那么这个SIMD隐藏latency的能力就会非常理想。
在更深入地了解occupancy之前,需要先了解什么情况下需要隐藏latency,换句话说,什么情况下需要提高occupancy。隐藏latency能够提高性能的前提是,一个不受 latency 限制的workload不会从提高occupancy中受益,比如说受限于ALU的workload。如果已经以100%的利用率运行,没有在等待某些内容上花费任何时间,那么我们不需要增加每个SIMD可用wave的数量。
反过来说,可能会从提高occupancy中受益的,只有受 latency 限制的workload。大多数workload遵循以下模式:加载数据,对其进行一些ALU操作,存储数据。因此,一个可能从添加更多wave中受益的workload需要满足:wave的数量乘以运行ALU操作所需的时间小于加载数据所需的时间。通过增加正在运行中wave的数量,我们可以增加在ALU中执行的计算操作的数量,从而增加ALU的工作总量。这样一来,即使数据加载存在延迟,GPU仍然可以执行更多的计算任务,因此可以隐藏加载数据的产生的latency 。
话虽如此,occupancy并不是万能的,提高occupancy也可能降低性能。在严重受内存限制的场景中,提高occupancy可能没有收益,特别是在加载和存储操作之间几乎没有进行任何工作的情况下。如果着色器已经受到内存限制,提高occupancy将导致更多的缓存冲突,并且对隐藏latency没有帮助 。如常所言,这是一个权衡的过程。
Theoretical occupancy| occupancy的理论值
So far we have described occupancy as a consequence of an internal scheduling mechanism, so let’s talk about the specific components that can affect that. As mentioned earlier, to be able to quickly switch between wavefronts the SIMD reserves in advance all the required resources to run all the assigned wavefronts. In other words, the GPU can only assign wavefronts to a SIMD if enough resources are available for them to run. In general, those resources are the Vector General Purpose Registers (VGPRs), the Scalar General Purpose Registers (SGPRs) and the “groupshared” memory, which we call the Local Data Share (LDS). On RDNA GPUs however, each wavefront is assigned a fixed number of SGPRs and there are always enough of those to fill the 16 slots.
The amount of resources required by a shader to run on a SIMD is evaluated at compile time. The shader compiler stack will compile the high-level code (HLSL, GLSL etc.) to GPU instructions and assess how many GPRs and how much LDS is required for the shader to run on a SIMD. On RDNA GPUs it will also make a decision about whether the shader should run in the native wave32 mode, or in wave64 mode where the wavefront contains 64 threads. Wave64 shaders run each wavefront over 2 cycles, and have higher resource requirements, as you might guess.
For compute shaders, the threadgroup size is another factor in the theoretical occupancy. When writing a compute shader, the user must define the number of threads that will execute as a group. This is important because all the threads of a single threadgroup can share data through some shared memory called Local Data Share (LDS). In RDNA-based GPUs, the LDS is part of the Work Group Processor (WGP). This means that all the threads from a single threadgroup have to execute on the same WGP, otherwise they wouldn’t be able to access the same groupshared memory. Note: this restriction only applies to compute shaders. In general, not all wavefronts that are assigned to a single SIMD need to be part of the same draw or dispatch.
Using all those constraints, it is possible for you to calculate the theoretical occupancy of a shader on a given GPU and know which resource might be limiting it, but we make that easy in Radeon GPU Profiler (RGP) on the pipeline tab, as shown in the following image. It indicates the current theoretical occupancy, which resource is the limiting factor, and by how much it needs to be reduced to increase the occupancy by 1. If you’re willing to do the computation by hand, the pipeline tab still shows how many resources are required by the shader, which wave mode it is running in, and the threadgroup size if it is a compute shader.
到目前为止,我们已经将occupancy描述为内部调度机制的一种成果,现在让我们来谈谈可能影响occupancy的具体组件。如前所述,为了能够快速在wavefront之间进行切换,SIMD会提前预留好运行所有已分配wavefront所需的资源。换句话说,只有在有足够的资源可用于运行时,GPU才能将wavefront分配给SIMD。一般来说,这些资源包括向量通用寄存器(Vector General Purpose Registers,VGPR)、标量通用寄存器(Scalar General Purpose Registers , SGPRs)和称为本地数据共享(Local Data Share,LDS)的“groupshared”内存。然而,在RDNA GPU上,每个wavefront被分配了固定数量的SGPR,并且总是有足够的SGPRs来填充16个 slot。
一个着色器在SIMD上运行所需的资源量是在编译时评估好的。着色器编译器栈将高级代码(如HLSL、GLSL等)编译为GPU指令,并评估着色器在SIMD上运行所需的VGPR和LDS的数量。在RDNA GPU上,它还会决定着色器是否应该以本机wave32模式运行,还是以每个wavefront包含64个线程的wave64模式运行。Wave64着色器在2个周期内运行每个wavefront,并且具有更高的资源需求。
对于 compute shaders 计算着色器而言,线程组大小也是occupancy的理论值的另一个限制因素。在编写计算着色器时,用户必须定义单个线程组中线程的数量。这很重要,因为单个线程组的所有线程可以通过一些称为 LDS 的共享内存共享数据。在基于RDNA的GPU中,LDS是工作组处理器( Work Group Processor, WGP)的一部分。这意味着单个线程组的所有线程必须在同一个WGP上执行,否则它们将无法访问相同的groupshared内存。注意:此限制仅适用于计算着色器。一般而言,并不是分配给单个SIMD的所有wavefront都必须属于同一个绘制或分派。
利用所有这些约束条件,您可以计算出在给定GPU上的着色器的occupancy理论值,并知道哪个资源可能是限制因素,以及需要将其减少多少才能使occupancy增加1。如果您愿意手动计算,管线选项卡仍然显示着色器所需的资源数量,它正在运行的wave模式以及如果是计算着色器,则显示线程组大小。
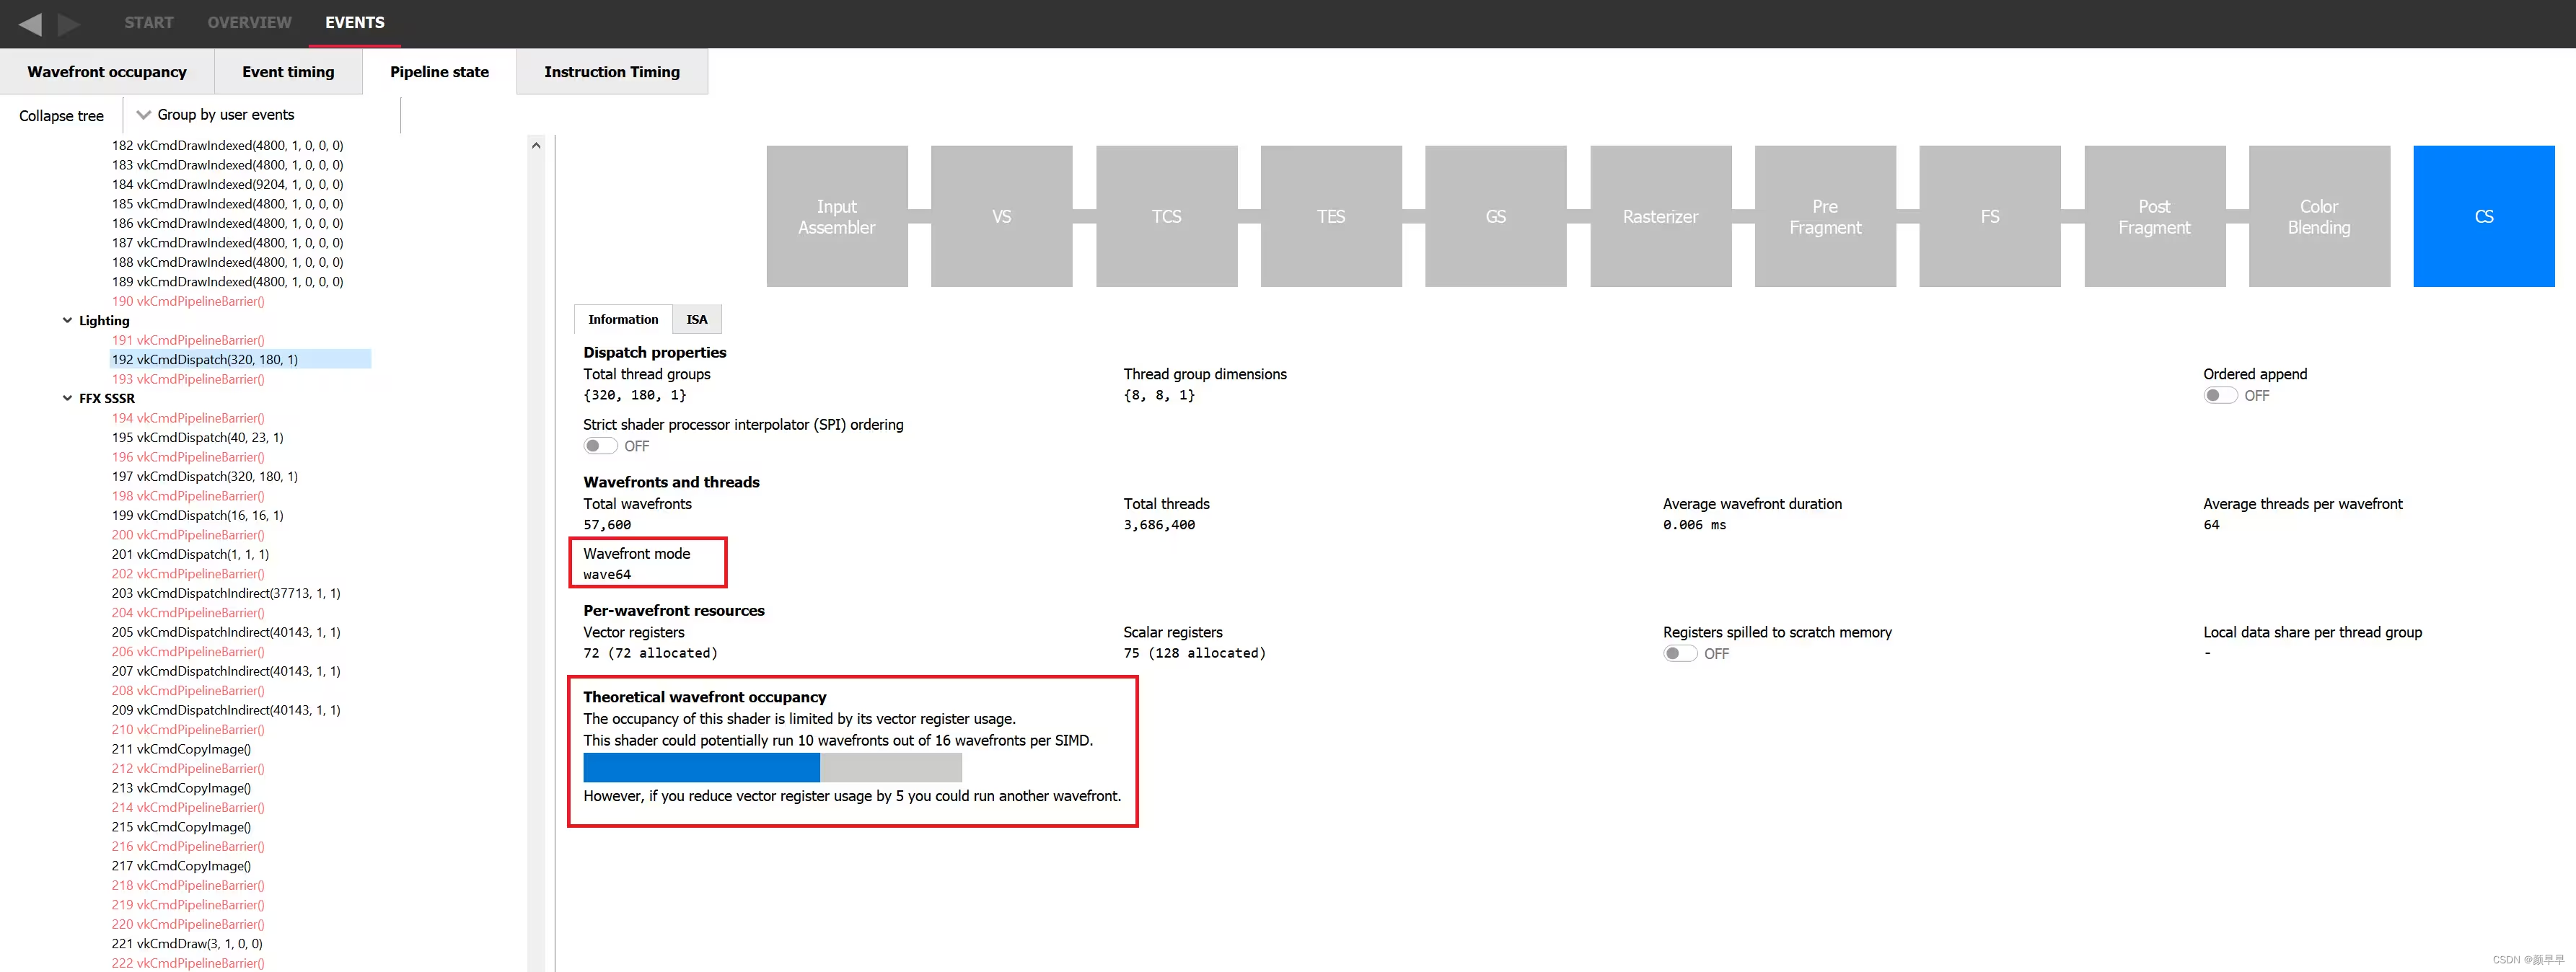
The pipeline tab of RGP
Let’s take an example where the theoretical occupancy is limited by VGPR pressure. For instance, let’s consider a shader that requires 120 VGPRs and is not limited by LDS otherwise. If we go to the device configuration tab of RGP we can see that for the AMD Radeon RX 7900 XTX GPU, there are 1536 VGPRs available per SIMD. This means that in wave32 mode, since 1536 / 120 = 12.8, we can assign 12 wavefronts to a SIMD. This also means that in theory, for a shader that requires only 118 VGPRs, 13 wavefronts can be assigned. In practice, VGPRs have allocation granularity greater than 1, and so that shader would need to request less than 118 VGPRs to be assigned 13 times. The size of a block depends on the architecture and wave mode but RGP will tell you exactly how many VGPRs you need to save to be able to assign a new wave. In wave64 mode, we would need to save even more VGPRs to be able to assign one more wavefront.
让我们以occupancy理论值受VGPR压力限制的示例为例。例如,假设我们考虑一个需要120个VGPR的着色器,并且不会受到除了VGPR限制之外的其他因素(比如LDS)的限制。如果我们转到RGP的Device configuration窗口,我们可以看到AMD Radeon RX 7900 XTX GPU每个SIMD可用的VGPR数量为1536。这意味着在wave32模式下,1536 / 120 = 12.8,我们会将12个wavefronts分配给一个SIMD。这也意味着在理论上,对于只需要118个VGPR的着色器,可以分配13个wavefronts。实际上,VGPR分配时的最小单位大于1,因此该着色器所需的VGPR得少于118个才会相应地分配13个wavefront。一个块的大小和architecture和wave模式相关,但RGP会告诉您需要节约出多少个VGPR才能够多分配一个wave。另外,在wave64模式下,我们需要节约出更多的VGPR才能分配一个额外的wavefront。
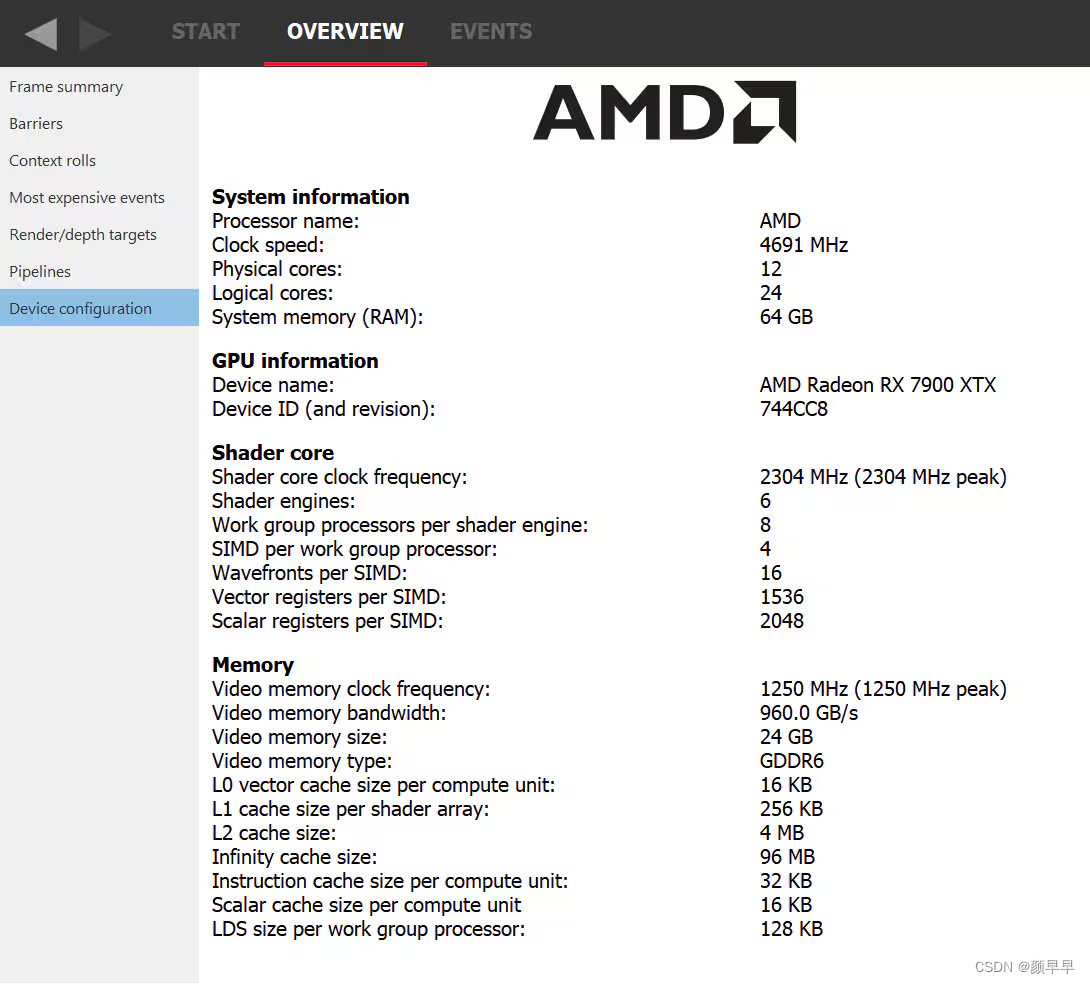
The overview tab of RGP
Understanding where the register pressure is coming from is not an easy task without the proper tools. Fortunately, Radeon GPU Analyser (RGA) is here to help. RGA lets you compile shaders from high-level source code into AMD ISA and provides insight into the resulting resource requirements. For instance, it can display how many VGPRs are alive for each instruction of the program at the ISA level.
This kind of visualization is very helpful to identify potential VGPR usage spikes in a particular shader. Because the GPU allocates for the worst case requirements in the shader, a single spike in one branch of the shader can cause the entire shader to require a lot of VGPRs, even if that branch is never taken in practice.For more information on how to use RGA, please check the dedicated GPUOpen RGA page and our guides on Live VGPR Analysis: Live VGPR analysis with RGA and Visualizing VGPR pressure with RGA..
在没有适当的工具的情况下,理解 register pressure(寄存器资源紧张,供不应求的状态) 来源并不容易。幸运的是, Radeon GPU Analyser (RGA) 可以提供帮助。RGA允许您将高级源代码编译成AMD ISA的着色器,进而分析着色器的资源需求,特别是寄存器需求。例如,它可以显示程序的每条指令在ISA级别上有多少个alive 的VGPR。
这种可视化非常有助于识别特定着色器中潜在的VGPR使用峰值。因为GPU为着色器中的最坏情况需求进行分配,着色器中某个分支的单个峰值可能会导致整个着色器需要大量的VGPR,即使该分支在实际中永远不会执行。有关如何使用RGA的更多信息,请查阅专门的 GPUOpen RGA page 页面以及我们关于 Live VGPR analysis with RGA 和 Visualizing VGPR pressure with RGA 的指南。
RGA中的寄存器压力可视化功能可以帮助您更好地理解着色器的资源需求和性能特征。
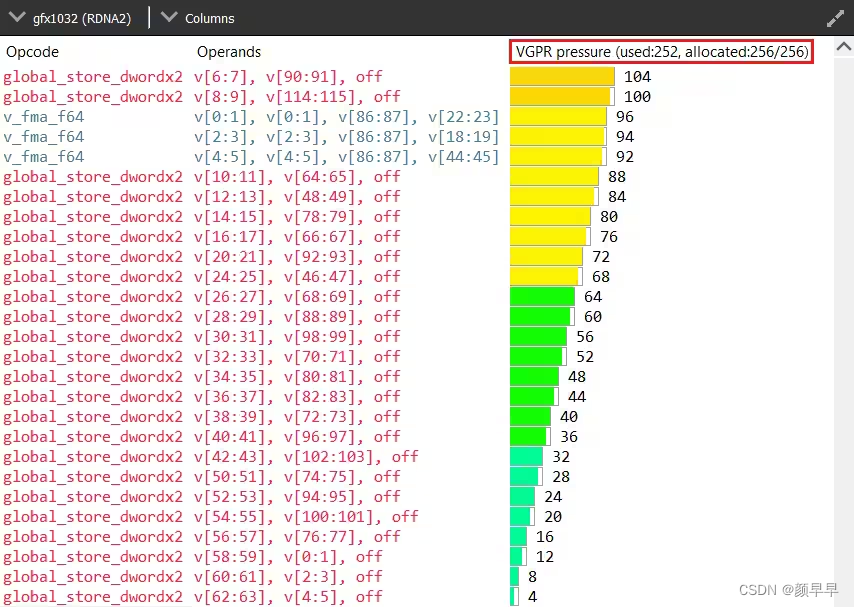
Register pressure visualisation in RGA
Measured occupancy | occupancy实际测量值
The theoretical occupancy or maximum achievable occupancy is only an upper bound of what we’ll call now the measured occupancy. RGP is a great tool to explore the measured occupancy and we will be using its dedicated wavefront occupancy tab for this next section. In this view, the top graph plots the measured occupancy, and the bottom bar chart shows how the different draws and compute dispatches overlap on the GPU. From now on, we’ll use the term “work item” to talk about them both. To get more information on a specific work item, just select it from the bottom bar chart and look at the details panel on the right hand side.
occupancy的理论值只是我们这一节讨论的“occupancy实际测量值”的上限。RGP是一个很好的探索occupancy实际测量值的工具,在接下来的部分中,我们将讨论RGP中专门用来显示wavefront occupancy的选项卡。在此视图中,顶部图表显示了occupancy的实际测量值,底部天蓝色的柱状图显示了不同的绘制和计算调度在GPU上的并行运行情况,我们将使用术语 "work item(工作项)" 来指代它们。要获取有关特定work item的更多信息,只需从底部柱状图中选择它,然后查看右侧的详细信息面板。
The wavefront occupancy tab of RGP / RGP的wavefront occupancy 选项卡
The occupancy column of the details panel shows the theoretical occupancy for this specific work item. In this capture we can immediately see that the measured occupancy is not constant and does not necessarily match the theoretical occupancy. In the following image, the measured occupancy graph lies within the blue rectangle, the selected work item is in the orange rectangle and the green one shows where to look for theoretical occupancy in the details panel.
There are mainly two reasons why the measured occupancy can’t reach the theoretical occupancy, either there is not enough work to fill all the slots or the GPU is not able to launch those wavefronts quickly enough.
详细信息面板的occupancy列显示了该特定工作项的occupancy的理论值。在图示这个截帧中,我们可以看到occupancy的实际测量值不是恒定的,也不一定与occupancy的理论值相匹配。在截图的下半部分中,蓝色矩形圈的是occupancy的实际测量值,橙色矩形圈的是选中的 work item,绿色矩形表示在详细信息面板中显示的occupancy的理论值的位置。
occupancy的实际测量值无法达到理论值主要有两个原因,要么没有足够的工作来填满所有的slot,要么GPU无法快速启动这些wavefront 。
Lack of work limited occupancy | 受工作不饱和限制的占用率
An AMD Radeon™ RX 7900 XTX has 6 Shader Engines (SEs), 8 Work Group Processors (WGPs) per SE, and 4 SIMDs per WGP. This gives you a total of 6 * 8 * 4 = 192 SIMDs. So any workload short of 192 * 16 = 3072 wavefronts (remember there are 16 wavefront slots per SIMD) will never be able to reach 100% occupancy, even if the wavefronts are never resource limited. This scenario is usually pretty rare and fairly easy to detect.
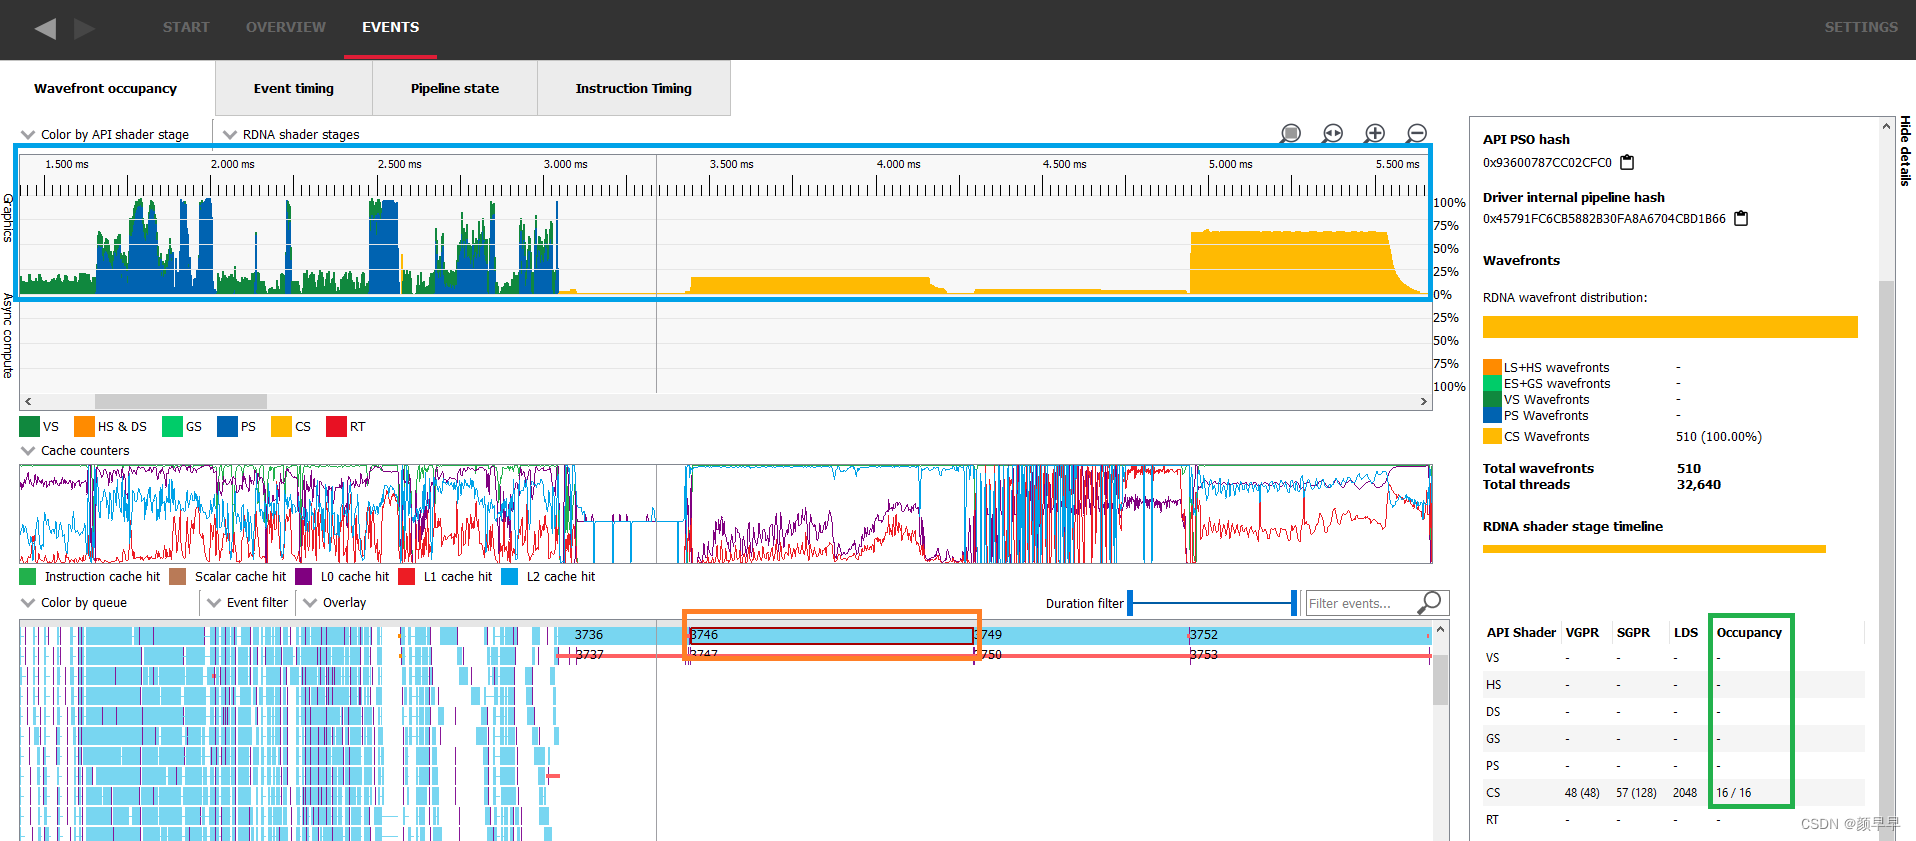
The execution of such a small workload will be very quick on the GPU and the details panel will display how many wavefronts were assigned in total. In the following image, the selected work item’s theoretical occupancy is 16/16 as shown in green in the details panel, yet the measured occupancy doesn’t even reach 4/16 as shown in blue. This is because there are only 510 wavefronts in flight as shown in orange in the details panel.
AMD Radeon™ RX 7900 XTX具有6个着色器引擎(Shader Engines,SEs),每个SE有8个工作组处理器(Work Group Processors,WGPs),每个WGP有4个SIMD,所以一共是 6 * 8 * 4 = 192个SIMD。因此,任何少于192 * 16 = 3072个wavefront(记住每个SIMD有16个wavefront slot)的workload都无法达到100%的occupancy,即使wavefront从未受到资源限制。这种情况通常非常罕见,而且相对容易检测出来。(Xclipse940是1个Shader Engine,每个Shader Engine有6个Work Group processor,每个Work Group processor有4个SIMD,每个SIMD16个wavefront。因此,任何少于 1*6*4*16 = 384 个wavefront的workflow都无法达到100%的occupancy)
对于这样一个非常小的workload,在GPU上执行速度非常快,并且详细信息面板会显示总共分配了多少个wavefronts。在下面的图像中,选定的work item在详细信息面板中显示的理论占用率为16/16(绿色框),但测量占用率甚至不到4/16(蓝色框)。这是因为详细信息面板中显示只有510个wavefront正在运行(橙色框)。
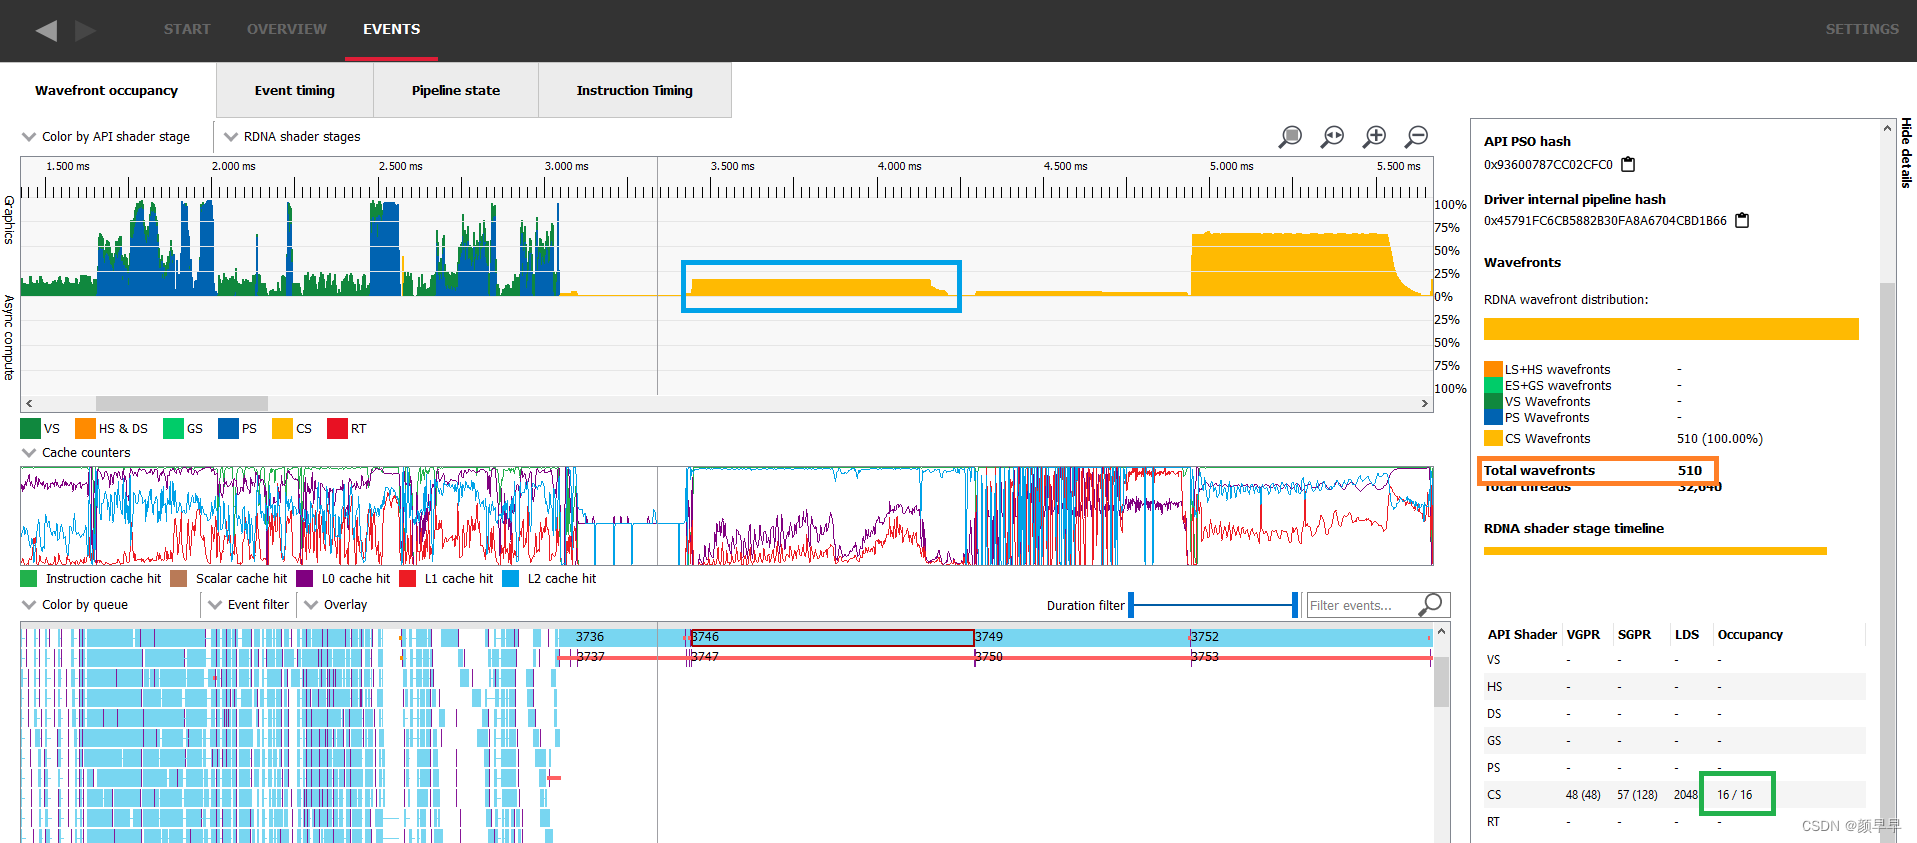
A small workload not filling the GPU entirely, visualized in the wavefront occupancy tab of RGP
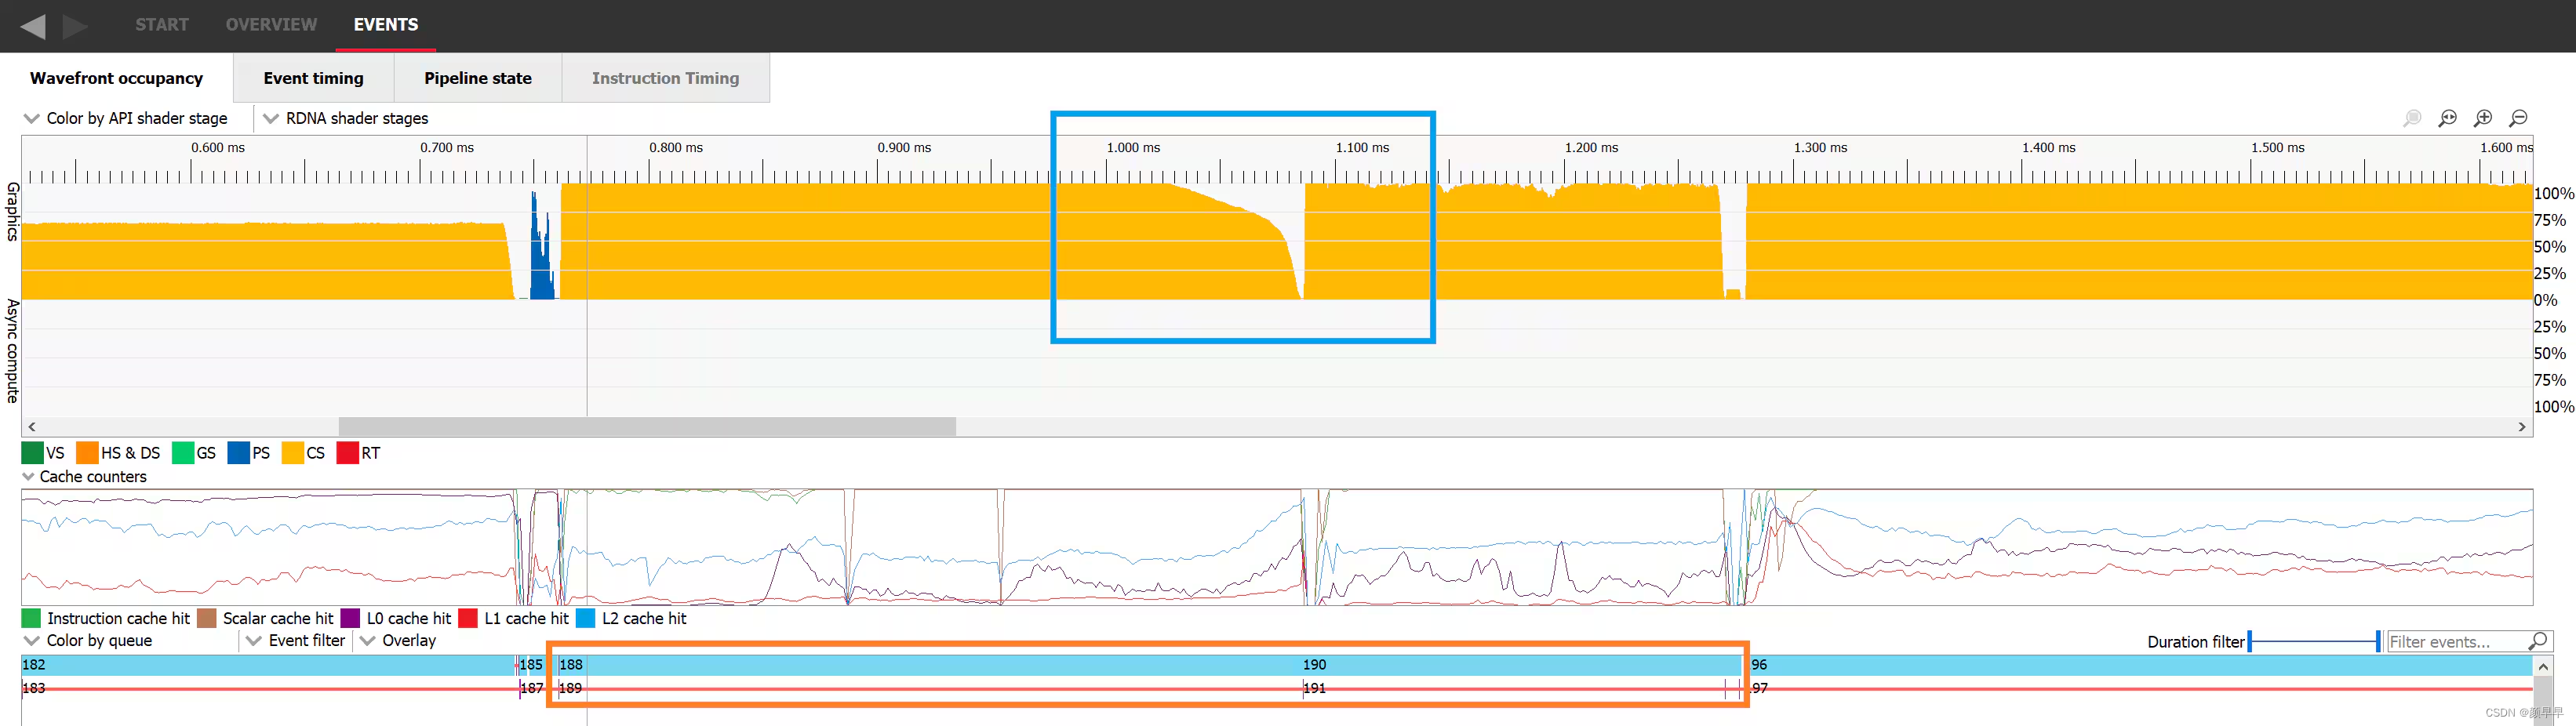
Another classic scenario where there aren’t enough waves in flight to fill the GPU is at the end of the execution of a workload when most of the work is done and only a few remaining wavefronts need to be executed. In the following image, we can see in the blue rectangle that dispatch 188 starts ramping down a bit before 1.05ms and doesn’t remain at its full occupancy for the whole duration of its execution. As soon as all the threads of dispatch 188 are retired, dispatch 190 starts. This happens because event 189 is a barrier preventing the two dispatches from overlapping.
另一个经典的情况是在工作负载执行结束时,没有足够的wavefront在GPU上运行。此时,大部分工作已经完成,只剩下一些wavefront需要执行。在下面的图像中,我们可以看到在蓝色矩形中,调度188在1.05毫秒之前开始逐渐减少,并且在整个执行期间并未保持完全占用。一旦调度188的所有线程都退出,调度190就开始执行。这是因为事件189是一个屏障,阻止了这两个调度之间的重叠。
Occupancy decreasing at the end of dispatch 188, visualized in the wavefront occupancy tab of RGP
If we switch to the Event timing tab, we can look at the events in a more sequential order. Dispatch 188 was issued, then a resource barrier was issued which prevents overlap with the next work item, and finally dispatch 190 was issued.
如果我们切换到Event timing 选项卡,我们可以按照更有序的方式查看事件。首先是 188 开始执行,然后发出资源barrier ,防止与下一个work item重叠,最后190 开始执行。
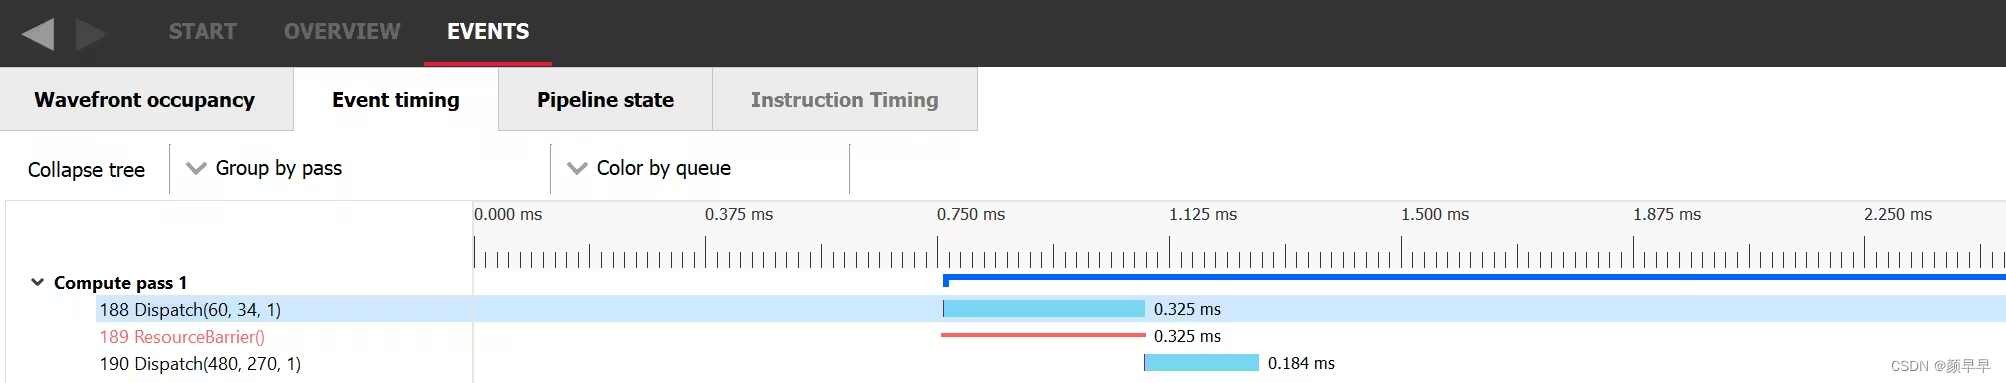
Work items 188 to 190 visualized in the event timing tab of RGP/在RGP的事件定时选项卡中可视化的工作项188至190
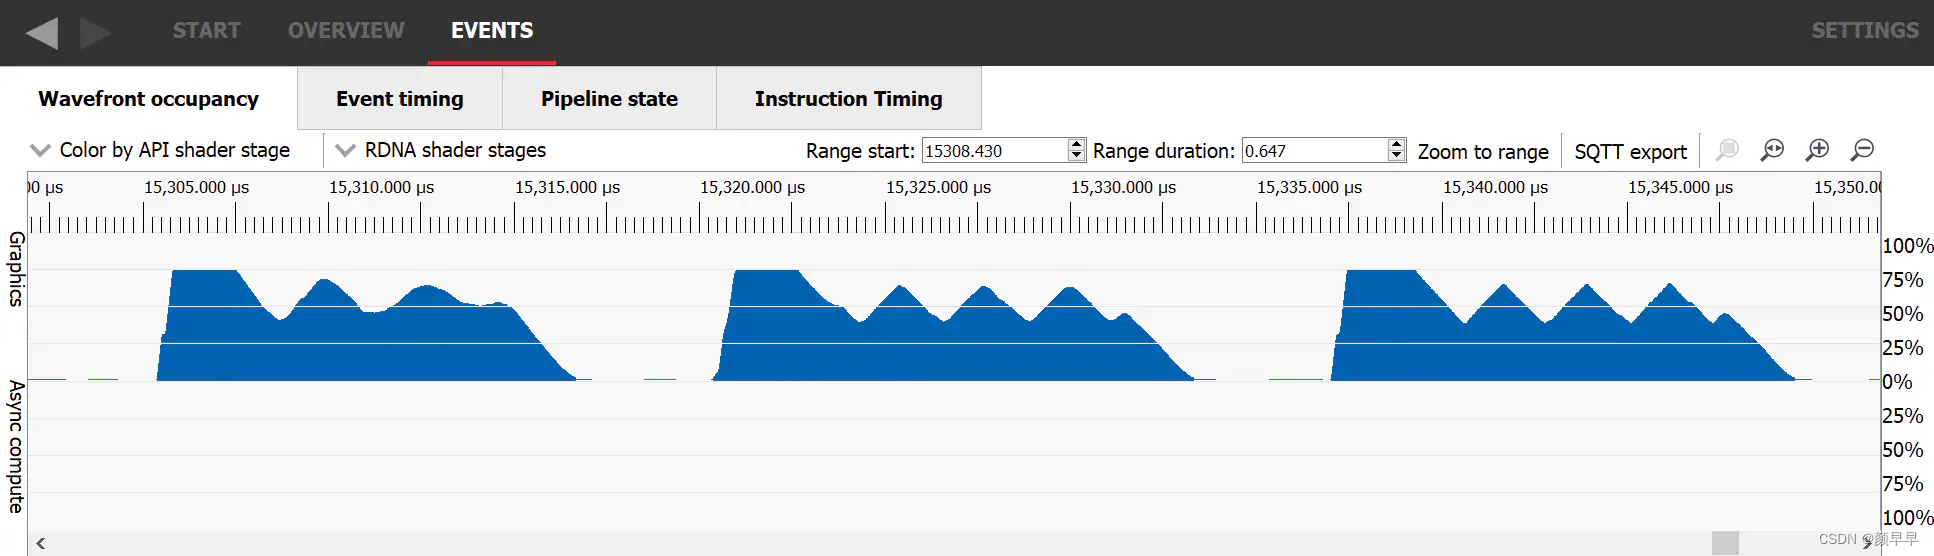
The way to improve occupancy for both of those scenarios is to find a way to overlap work. If we can manage to make two occupancy-limited workloads execute in parallel, it’s likely the overall occupancy of the GPU will increase. To make this happen, we need to pick two workloads that don’t have any dependencies with one another and issue them to a command list without any barrier between them. In the following picture we can see dispatch 5311 where occupancy is represented in yellow nicely overlapping with draw 5312 where occupancy is represented in blue. Sadly, this is not always possible.
改善这两种情况下的occupancy的方法是找到一种方式来重叠工作。如果我们能够使两个occupancy-limited 的工作负载并行执行,GPU的整体占用率可能会增加。为实现这一点,我们需要选择两个互不依赖的工作负载,并将它们发出到一个command list 中,两个工作负载之间没有任何barrier 。在下图中,我们可以看到调度5311(占用率以黄色表示)与绘制5312(占用率以蓝色表示)很好地重叠。不过,这并非总是可行的。
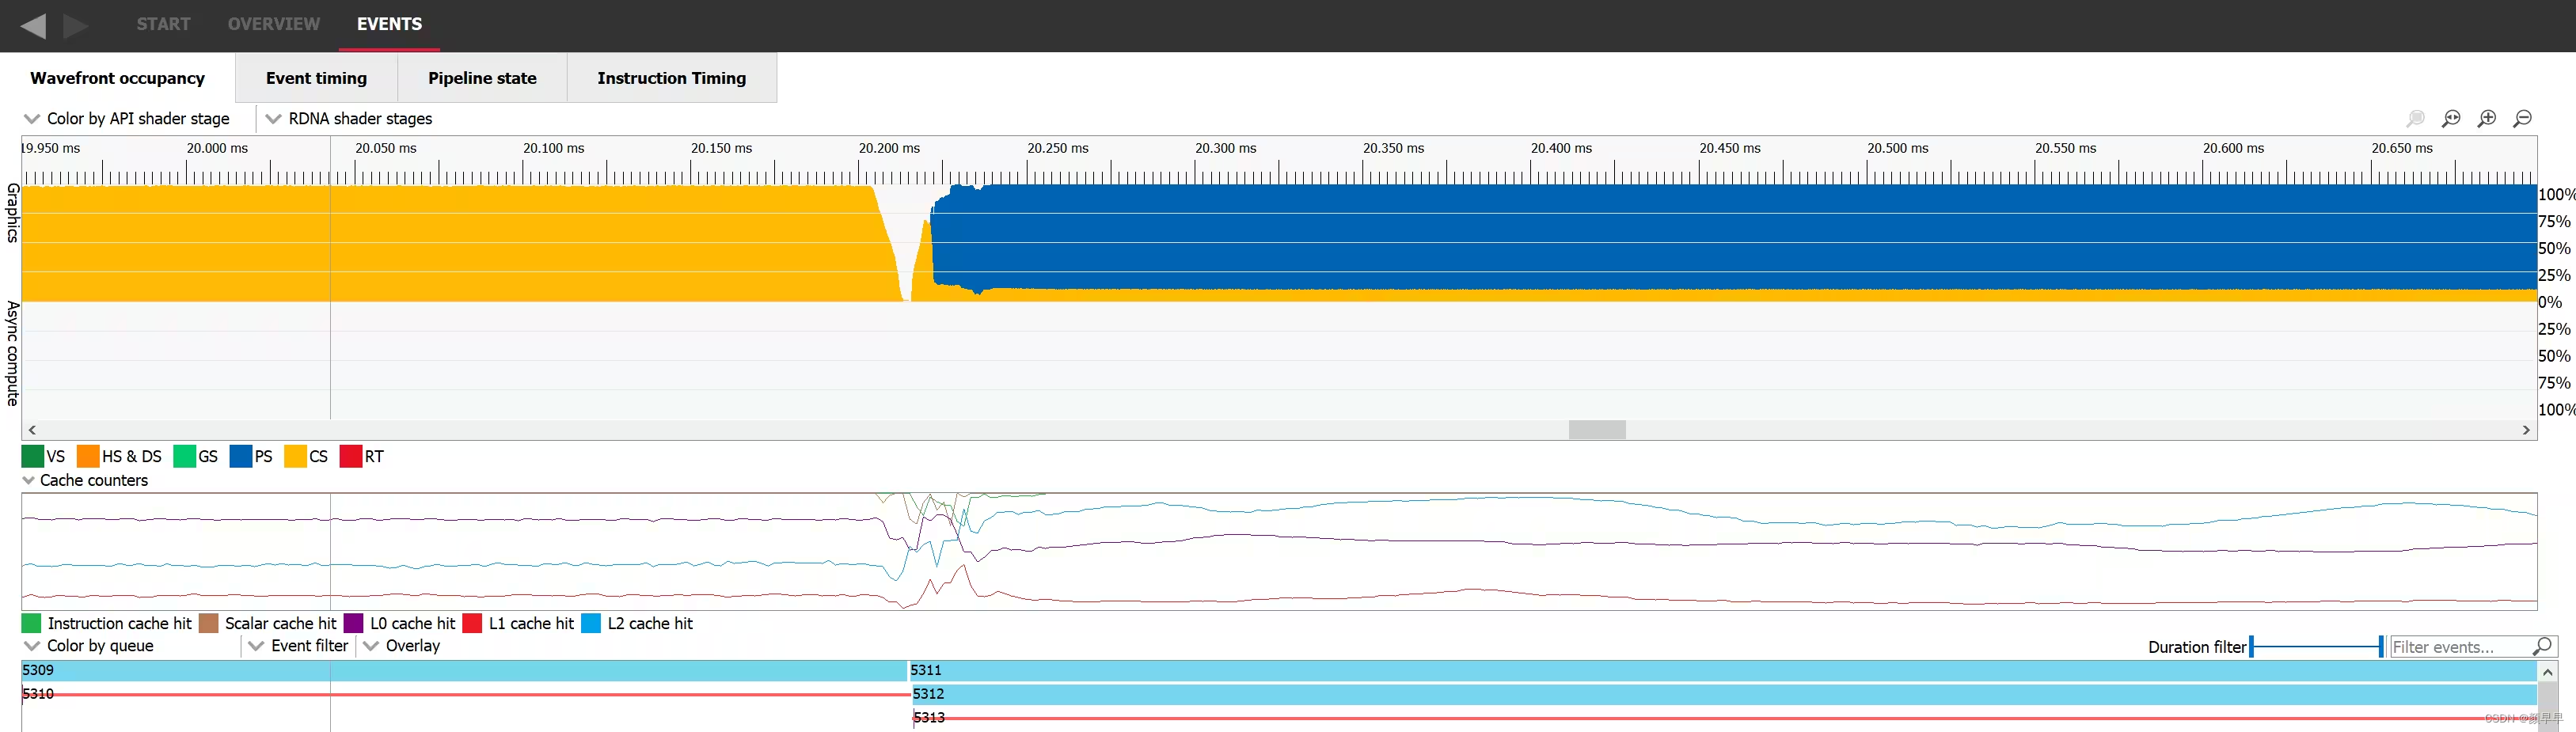
A dispatch and a draw's executions overlapping, visualized in the wavefront occupancy tab of RGP/在RGP的 wavefront 占用率选项卡中,显示了调度和绘制的执行重叠。
Launch rate limited occupancy | 启动速率限制的占用率
Figuring out when the occupancy is limited by the GPU not being able to launch waves fast enough is a bit trickier. The most obvious place is when two workloads have a dependency. The GPU needs to drain the first workload before the second one can start. Once the second starts from an empty GPU, the measured occupancy rises as the GPU ramps up on work. This usually only lasts for a really short period of time and is unavoidable. In this case again, the only solution would be to remove the dependency and make the two workloads overlap as we described in the previous paragraph.
However, the same thing can happen in the middle of the execution of certain workloads if the waves for that workload execute faster than the GPU can launch them. This is not ideal and the occupancy will be limited by the rate at which the GPU can launch waves. Launching a new wave is a more complex operation than simply assigning it to a SIMD so it can run. Work has to be done to setup the contents of various registers so that execution can start, and each shader type has particular requirements.
The easiest way to detect a launch rate limited occupancy in a RGP capture is to look for a workload that started with a really high occupancy, which then decreased and never caught that peak occupancy again. It will often oscillate before stabilizing to its average value. At the beginning of such workloads, many waves are launched on the GPU but then stall waiting for some initial data to be made available. Once the data required to execute the waves is at least partially cached, they execute faster than the GPU can start more, making the occupancy decrease, and so on.
判断GPU是否因为wavefront的启动速度慢导致occupancy 受限会稍微复杂一些。最典型的情况是当两个workload存在依赖关系时,GPU需要处理完第一个workload才能开始第二个workload。一旦第二个工作负载从一个空载GPU开始运行时,我们可以观测到occupancy随着任务加载逐渐上升但这种低效状态指挥持续很短的时间,而且不可避免的。在这种情况下,唯一的解决方法是消除两个workload之间的依赖关系,使两个workload能够像上一节的内容描述的那样重叠执行。
occupancy受到wavefront的启动速度限制这个现象,也可能出现在一些workload的执行中期:当workload的wavefront的执行速度超过了GPU launch 一个新的wavefront的能力时候,occupancy就会受到wavefront的启动速度的限制。从硬件层面来分析,将wavefront分配给SIMD单元只是将其加入执行队列,而实际launch一个wavefront需要完成完整上下文准备:设置指令指针(PC)、初始化通用寄存器(GPR)、配置着色器专用寄存器(如VS/PS/CS各有不同设置)、绑定常量缓冲区(constant buffers)等操作(类比CPU的线程上下文切换,需数百时钟周期)。所以相对而言,每个新wave需配置指令指针/寄存器/着色器参数等上下文环境,耗时会比较高。
在RGP中识别此类问题的流程是:观察初始占用率极高→快速下降→无法恢复峰值→出现振荡波动(oscillate)→最终稳定在平均值的特征曲线。这种振荡反映了GPU在动态平衡波形发射速率和执行速率时的暂态过程。在这种workload的开始阶段,许多wavefront在GPU上启动,但因为在等待某些初始数据所以发生了等待。一旦所需的数据里至少某些部分已经被缓存起来了,wavefront就可以直接从缓存中访问数据,无需等待数据加载。这使得wavefront执行的速度快于wavefront启动的速度,导致occupancy 下降。
A work item whose occupancy is limited by launch rate, visualized in the wavefrot occupancy tab of RGP/在RGP的wavefront occupancy 选项卡中可视化的受启动速率限制的work item 。
For a pixel shader, if none of the previously described situations seem to match your workload, it’s possible that the GPU is running out of LDS to store the interpolants sent from the VS to the PS. Unfortunately, the amount of LDS required for a PS cannot be evaluated at compile time. It depends on how many unique primitives a single wavefront is dealing with which is evaluated at runtime. In this case, one should investigate what kind of geometry is being rendered. If a lot of tiny triangles are being drawn, it’s likely that each wavefront will end up dealing with multiple primitives. One way to mitigate this issue to tune your game’s level of detail (LOD) system.
对于像素着色器而言,如果之前描述的情况都不适用于你的workload,那么可能是因为GPU的LDS(局部数据共享)不够,不足以存储从顶点着色器传递到像素着色器的插值值。不幸的是,像素着色器所需的LDS数量无法在编译时评估。它取决于单个wavefront处理的 unique primitives 数量,在运行时才会计算。在这种情况下,你应该检查正在渲染的几何图形的类型。如果正在绘制许多小三角形,那么每个wavefront最终可能会处理多个基元。缓解此问题的一种方法是调整游戏的LOD系统。
Occupancy limiters | 限制因素
In the previous paragraphs, we tried to give an understanding of what the occupancy limiters are and why. However, when investigating occupancy in practice it might be easier to have a tool identify for you which parts of the frame are occupancy limited and by which limiting resource.You can request those directly in the bottom part of the overview tab.
在前面的段落中,我们试图解释了occupancy 的限制因素及其原因。不过在实际应用上有更简单直接的方法,可以使用工具来确定这一帧中的哪些部分受occupancy 限制,以及受限制的资源是什么。这正是由微软® PIX的AMD插件提供的"WaveOccupancyLimiters"所能实现的。你可以直接在overview选项卡的底部查看这些信息。
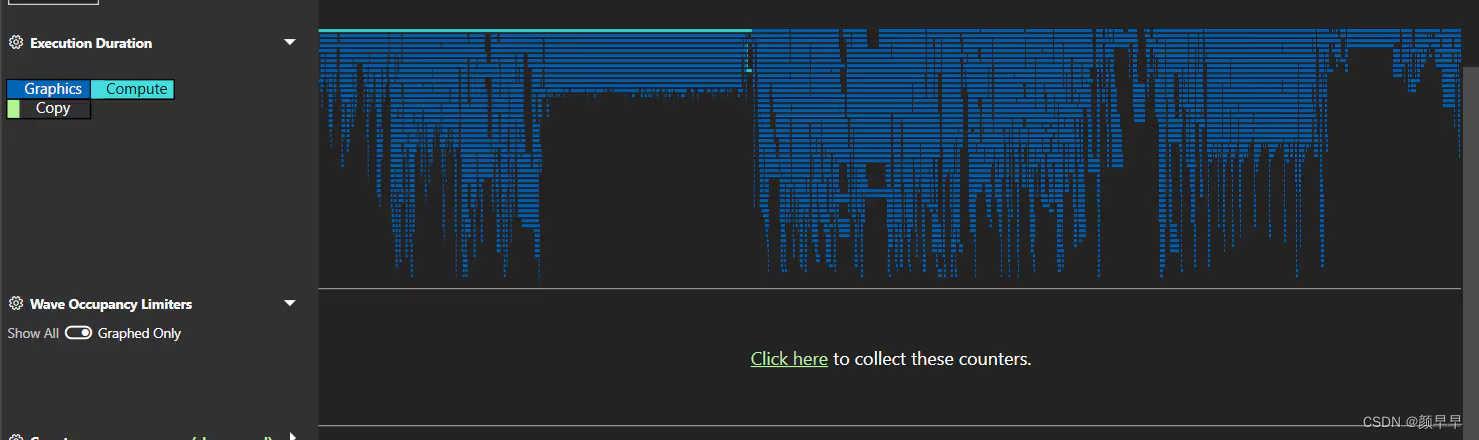
The wave occupancy limiters before counters collection visualized in PIX
Once the counters are captured, PIX will plot them against time just like the other counters.
在收集计数器之前,PIX将以图形化的方式绘制它们随时间的变化情况,就像其他计数器一样。
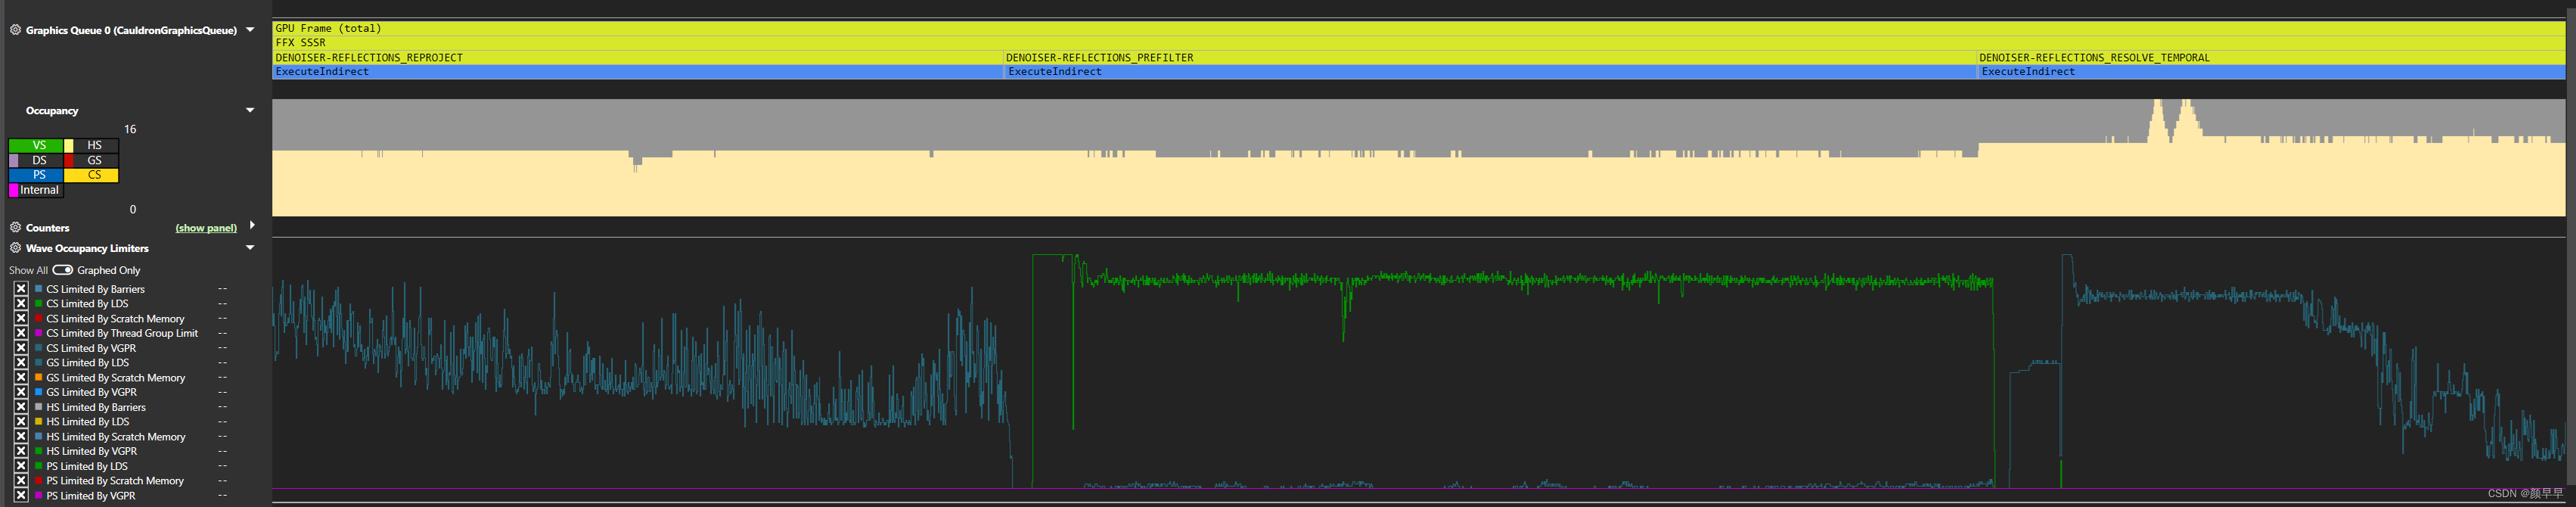
The wave occupancy limiters after counters collection visualized in PIX
Limiters list | 限制因素列表
If we look at the list of counters, we can see that even though they are specialized by wave type, they can mostly be split into 4 categories.
Limited by VGPR
Limited by LDS
Limited by Thread Group Size
Limited by Barriers
如果我们查看计数器列表,我们可以看到尽管它们根据wave 类型进行了专门化,但它们主要可以分为四类。
受VGPR限制
受LDS限制
受线程组大小限制
受Barrier 限制
The first three ones we’ve seen before. In order to launch wavefronts on a SIMD, the scheduler needs to reserve all the required execution resources they might need in advance, including VGPRs and LDS. In the case of a compute shader, there must be enough of these resources for the entire threadgroup. Because you define the size of that threadgroup, you can influence this resource requirement.
As for barriers, the GPU can track up to 16 barriers in flight per pair of SIMDs. As a reminder, each SIMD can have 16 waves assigned, for a total of 32 waves per SIMD pair. When running compute shaders, the resources required to run an entire threadgroup will be allocated and deallocated together, which means the GPU needs to be able to synchronize the waves that make up a threadgroup at the end of their execution. This synchronisation requires a barrier and it is thus possible to use up all the barrier resources in a worst case scenario.
A barrier is only required if a threadgroup is made of at least 2 waves. So we can at most have 32 / 2 = 16 threadgroups that require a barrier. This is perfect since we have 16 barrier resources. However, if 1 wave finishes, it frees a slot on the SIMD but it can’t free its needed execution resources because it has to wait for the 2nd wave of its threadgroup to finish too. Since a wave slot is now available but cannot be filled, we are occupancy limited. In this scenario we are Thread Group Size limited because we need 2 wave slots to assign a single threadgroup.
Now, if the second wave of that threadgroup finishes, we’re not occupancy limited anymore. The slots, the resources and the barriers required for this entire threadgroup will be freed. However, if a wavefront from a different threadgroup finishes, we now have 2 slots available, potentially enough resources to run another threadgroup but no barrier available to launch it. In this case we are occupancy limited by barrier resources. This is a very specific case and in practice it will be super rare.
前三种我们之前已经了解过了。为了在SIMD上启动wavefront,调度器需要提前保留它们可能需要的所有执行资源,包括VGPR和LDS。对于计算着色器来说,必须为整个线程组提供足够的这些资源。由于你定义了线程组的大小,你可以影响这些资源需求。
至于 barrier ,GPU可以每对SIMD跟踪最多16个正在执行的 barrier 。提醒一下,每个SIMD可以分配16个wave,因此每对SIMD最多可有32个wave。在运行计算着色器时,为运行整个线程组所需的资源将一起分配和释放,这意味着GPU需要能够在它们执行结束时同步组成线程组的wave。这种同步需要一个 barrier ,因此在最坏情况下可能会使用完所有的 barrier 资源。
一个线程组至少得有2个waves时才需要 barrier ,因此,我们最多可以有32 / 2 = 16个需要barrier 的线程组。这正好对应我们有16个barrier 资源。然而,当一个wave完成的时候,它会释放SIMD上的一个槽位,但是因为还在等同一线程组中的其他wave完成工作,这个线程组涉及的执行资源都不会被释放,这是有空闲的槽位但是没办法给空闲的槽位而带来的occupancy。在这种情况下,我们受到线程组大小的限制,因为一个线程组需要两个slot 。
这个时候,如果又有一个线程组的wave完成,所有相关的资源被释放了,但跟前一个被释放资源的wave又不是同个线程组,可能会有一种特殊情况出现,叫“ occupancy limited by barrier ”:有足够的槽位和资源来运行另一个线程组,但没有可用的barrier ,因此无法启动新的线程组。这是一个非常特殊的情况,在实践中非常罕见。
现在,如果该线程组的第二个wave完成,我们就不再受到占用率的限制。为该整个线程组所需的slot、资源和 barrier 将被释放。然而,如果来自不同线程组的wavefront完成,我们现在有2个slot可用,潜在地有足够的资源来运行另一个线程组,但没有可用的 barrier 来启动它。在这种情况下,我们受到 barrier 资源的占用率限制。这是一个非常特殊的情况,在实践中非常罕见。
Reading the limiters graph | 解读限制因素图表
Because PIX plots these counters over time and displays the value of the counter as a percentage, it is natural to think that the lower the percentage the less occupancy bound the shader is. Sadly, this is not true at all. Those counters should mostly be used as a binary metric to figure out which resource is limiting the occupancy. To understand why that is, we need to understand how those are gathered. Every clock, if there are wave slots available, the scheduler will try to launch new waves. If that is not possible, the relevant occupancy limiter counters will be incremented. This will happen every clock as long as a wave slot is available and the GPU is not able to schedule a new wave. At the end of the workload, we’ll divide those counters by the number of total clocks the workload took to figure out what percentage of that workload was actually bound by those limiters.
The important thing to understand is that no matter what that percentage is, it doesn’t say anything about occupancy. Whether a workload that is running at a particular occupancy is limited has no impact on its ability to hide latency. All that matters is whether there’s enough occupancy to hide any latency. The limiter percentages will vary based on how long it takes for the waves to execute. If the waves are long-running, the scheduler will likely not often find any new waves to launch and thus count many clocks for that limiter. On the other hand, if the waves are very short, there are often new slots available and so the GPU less often fails to launch new waves. The limiters percentage can give us some idea of the way the GPU launches waves but it will not give any extra information on occupancy. If one of the counters is greater than 0, then it’s a limiter and that’s all we can infer from it.
由于PIX将这些计数器随时间绘制并将计数器的值显示为百分比,自然而然地会认为百分比越低,着色器的占用率限制就越小。然而,这完全不正确。这些计数器主要应该被用作二进制指标,以确定哪个资源限制了占用率。要理解其中的原因,我们需要了解它们是如何收集的。每个时钟周期,如果有可用的wave slots,调度器将尝试启动新的wavefront,如果启动不了,那么相关的occupancy limiter 计数器将被增加。只要存在有可用的wave slots且GPU无法调度新的wavefront的情况,这种计数每个时钟周期都会发生。在工作负载结束时,我们将通过将这些计数器除以工作负载所花费的总时钟数,来计算实际会受到那些limiters限制的工作负载所占的百分比。
重要的是要理解,无论百分比是多少,它对占用率没有任何影响。对于一个以某个占用率运行的工作负载,它有没有受到限制,不会对其隐藏latency的能力产生任何影响。唯一重要的是是否有足够的占用率来隐藏任何 latency 。限制因素的百分比将根据wavefront执行所需的时间而变化。如果wavefront执行时间较长,调度器可能很少找到新的wavefront可以启动,因此计数器会计算出许多时钟周期来表示该限制因素。另一方面,如果wavefront非常短,通常会有新的插槽可用,因此GPU更少地无法启动新的wavefront。限制因素的百分比可以让我们对GPU启动wavefront的方式有一些了解,但它不会提供任何有关占用率的额外信息。如果其中一个计数器大于0,则表示存在限制因素,这是我们能够推断出的全部信息。
Peak occupancy does not always mean peak | performance 高占用率并不总是意味着高性能
Before we move on to the practical implications of understanding GPU occupancy, it’s worth understanding one of the most important practical aspects of occupancy that you might encounter when you’re profiling and trying to optimise the performance of your shaders. We’ve discussed what intra-WGP shared resources can limit occupancy, which can give you the intuition that your job as the shader programmer is to maximise occupancy by limiting the usage of those shared resources.
However, there are also shared – and often scarce! – resources outside of the WGP in the rest of the GPU that your shaders make heavy use of when it comes to memory. Each external memory access has to pass through the GPU’s cache hierarchy, hopefully being serviced by the caches along the way so that it saves precious memory bandwidth and reduces execution latency. In any modern GPU there are multiple levels of that hierarchy for each access to pass through.
Because wavefronts from the same shader program tend to run together, doing roughly the same thing at roughly the same time, whenever they access memory they’ll tend to do so in groups. Depending on the shape of memory access being performed and the amount of data that is being written from or read into the shader, it’s possible to thrash the caches in the hierarchy.
So occupancy going up can mean performance goes down, because of that complex interplay between getting the most out of the GPU’s execution resources while balancing its ability to service memory requests and absorb them well inside its cache hierarchy. It’s such a difficult thing to influence and balance as the GPU programmer, especially on PC where the problem space spans many GPUs from many vendors, and where the choices the shader compiler stack makes to compile your shader can change between driver updates.
在我们讨论理解GPU占用率的实际影响之前,先在性能分析和优化着色器性能的时候会遇到的一个的问题。我们已经讨论了哪些intra-WGP共享资源会限制occupancy ,作为着色器程序员,需要通过限制这些共享资源的使用来提高occupancy 。
然而,在GPU的其余部分,还有一些共享资源(通常是稀缺的!),用于内存操作时,着色器会大量使用这些资源。每次外部内存访问必须经过GPU的缓存层次结构,希望能够命中缓存,命中缓存的话能节省宝贵的内存带宽并降低执行的 latency 。在任何现代GPU中,每次访问都需要通过多个层次的缓存。
由于来自同一着色器程序的wavefront很有可能是一起运行的,在大致相同的时间内做大致相同的事情,每当它们访问内存时,它们往往会以组的形式进行。内存访问的方式(比如连续访问,随机访问)和数据量(比如一次读取一个像素或者一整行数据)会影响缓存的表现,不当的访问模式可能导致缓存有可能会失效。(因为增加并行执行的线程数可能会增加内存访问的压力,导致缓存未命中和性能下降)
因此,Occupancy的增加也可能导致性能下降,因为在充分利用GPU的执行资源的同时,也需要在利用GPU的计算资源和有效地处理内存请求之间找到平衡。作为GPU程序员,这是一个非常难以影响和平衡的问题,特别是在PC上,因为会有来自于多个厂商的GPU,开发者需要考虑这些硬件差异,而且GPU 驱动程序的更新还会导致着色器编译器行为的改变,使得同一段代码在不同情况下的表现可能有所不同。
Practical implications | 实战经验
In this last section we wanted to concentrate all the knowledge we have tried to convey in this post to a format that can be more easily parsed if one were to visit this post again. We’ll first answer a few classic questions about occupancy and then provide a small guide on how to tackle improving occupancy for a given workload.
Q&A
Q: Does better occupancy mean better performance?
A: No, it will only improve performance if the GPU can use the occupancy to hide latency while balancing the available performance of the cache hierarchy.Q: When should I care about occupancy?
A: Primarily when a workload is sensitive to memory performance in some way.Q: Does maximum occupancy mean that all the memory access latency from my shader is hidden?
A: No, it only means that the GPU maximises its capacity to hide it.Q: Is lower theoretical occupancy always bad for performance?
A: Just as maximum occupancy can hurt performance, lower occupancy can help it, but always profile and always check that low occupancy shaders are not spilling registers to memory (see the last paragraph below).
在最后这一部分中,我们希望将我们在本文中试图传达的所有知识集中到一种更容易理解的格式中,以便在以后再次访问本文时能更容易地解读。我们首先回答一些关于占用率的经典问题,然后提供一个小指南,介绍如何改进给定工作负载的占用率。
Q&A| 问答
问:更高的occupancy 是否意味着更好的性能?
答:不,只有当GPU能够利用占用率来隐藏 latency 并平衡缓存层次结构的可用性能时,才会改善性能。
问:何时应该关注occupancy ?
答:主要是在某种程度上对内存性能敏感的workload 中。
问:最大occupancy 是否意味着我的着色器所有的内存访问 latency 都被隐藏了?
答:不,它只意味着GPU最大化了隐藏 latency 的能力。
问:较低的occupancy 对性能总是不利吗?
答:就像最大occupancy 可能会损害性能一样,较低的occupancy 可能会有所帮助,但都需要先进行性能分析,并确保低occupancy 的着色器不会将寄存器溢出到内存中(参见下面的最后一段)。
How to improve occupancy | 如何提高占用率
- If your theoretical occupancy is low and your measured occupancy matches it, try improving the theoretical occupancy with the following recommandations. Otherwise, skip to 2.
- Find the most limiting resource amongst VGPR and LDS and try to use less of those.
- Remember that a bigger wave size implies more resources per wave and thus less resource allocation granularity.
- While it is possible to ask for a specific wave size in Shader Model 6.6, please remember that it does not just affect the potential occupancy of a shader and should be used incredibly carefully. The full effects of such a change are complex and outside of the scope of this post, and it’s very difficult for wave size choices to be performance portable.
- For compute shaders, make sure the threadgroup size is not the limiting factor.
- If it is, try reducing its size to improve the granularity of the scheduling. For more information about the impacts of threadgroup size, please read the following GPUOpen article: Optimizing GPU occupancy resource usage with large thread groups.
- If your theoretical occupancy is decently high but your measured occupancy doesn’t match it, investigate the following points
- Make sure that your workload generates enough wavefronts to fill the GPU.
- If not, the only solution is to overlap some other workload with it.
- If your workload generates enough waves, make sure each wave has enough work to do to offset the cost of launching the wave.
- For compute shaders, try making each wavefront do more work by batching work items together.
- For fragment shaders, try reducing the number of interpolants sent from the VS to the PS to see if that helps.
- If none of the above applies and you’re optimizing a pixel shader, the GPU might be running out of LDS to store the interpolants. The amount of required LDS is heavily influenced by the number of primitives a SIMD is dealing with.
- If your geometry is made of a lot of tiny triangles, try improving your level of detail (LOD) system.
- 如果occupancy的理论值低,而测量值也和理论值相符,请尝试按照以下建议提高理论占用率。否则,跳至第2步。
- 找出在VGPR和LDS中最具限制性的资源,并尽量减少使用它们.
- 记住,wavefront变大,意味着每个wavefront有更多的资源,因此资源分配的粒度更粗,灵活性下降了.
- 虽然在Shader Model 6.6中可以要求特定的wavefront大小,但请记住,它不仅影响着色器的潜在occupancy ,而且应该非常谨慎地使用。这种变化的完整影响非常复杂,超出了本文的范围,而且wavefront大小的选择很难在不同的硬件上保持性能一致.
- 对于计算着色器,请确保线程组大小不是限制因素
- 如果是的话,请尝试减小线程组大小,以改善调度的粒度。有关线程组大小的影响的更多信息,请阅读以下GPUOpen文章:使用大型线程组优化GPU occupancy 资源使用: ptimizing GPU occupancy resource usage with large thread groups.
- 找出在VGPR和LDS中最具限制性的资源,并尽量减少使用它们.
- 如果occupancy的理论值相当高,但测量值与理论值不符,请调查以下几点
- 确保你的工作负载生成足够的wavefront来填充GPU.
- 如果不够,唯一的解决办法就是将一些其他工作负载与之重叠。
- 如果你的workload 生成了足够的wavefront,请确保每个wavefront有足够的工作量来抵消启动wavefront的成本.
- 对于计算着色器,尝试通过将工作项批处理在一起,使每个wavefront执行更多的工作.
- 对于片段着色器,请尝试减少从顶点着色器发送到像素着色器的插值器的数量,看看是否有帮助。
- 如果上述方法都不适用,并且你正在优化像素着色器,那么GPU可能没有足够的LDS来存储插值器。所需的LDS数量受SIMD处理的基元数量的影响.
- 如果你的几何图形由许多小三角形组成,请尝试改进你的细节级别(LOD)系统。.
- 确保你的工作负载生成足够的wavefront来填充GPU.
Side note: register spilling / 寄存器溢出
When we described theoretical occupancy, we first explained how it is tied to the amount of resources required by a wavefront to be executed. We also mentioned that a wavefront cannot be launched if there aren’t enough resources available for it, but that’s not strictly true when it comes to VGPR usage: the shader compiler has a mechanism in place that lets it “spill” registers to memory.
This means that instead of requiring the shader to use a huge amount of registers, it can decide to reduce that number and place some of those in memory instead. Accessing the data stored in memory has a much greater latency than accessing the data stored in physical registers and this usually greatly impacts the performance. While this is not strictly speaking related to occupancy, when a shader has a low theoretical occupancy and is limited by GPR pressure, it is worth checking whether it is spilling or not. The pipeline tab of RGP will let you know for a given work item if the shader compiler had to spill registers to memory.
当我们描述occupancy的理论值时,我们首先解释了它与wavefront执行所需资源量的关系。我们还提到,如果没有足够的资源可用,就无法启动wavefront,但在VGPR使用方面,这并不完全正确:着色器编译器有一种机制,可以将寄存器“溢出”到内存中。
这种机制可以减少寄存器的数量,并将其中一部分放入内存中,而不是让着色器使用大量的寄存器资源。然而因为访问内存的 latency 比访问寄存器的latency要大得多,所以寄存器溢出对性能有有严重的影响。严格来说这与occupancy没有直接关系,但当一个着色器具有较低的occupancy的理论值并且受到寄存器压力限制的场景中,应该去确认一下有没有发生了溢出。RGP的pipeline 选项卡可以告诉你对于给定的work item,着色器编译器是否将寄存器溢出到内存中。
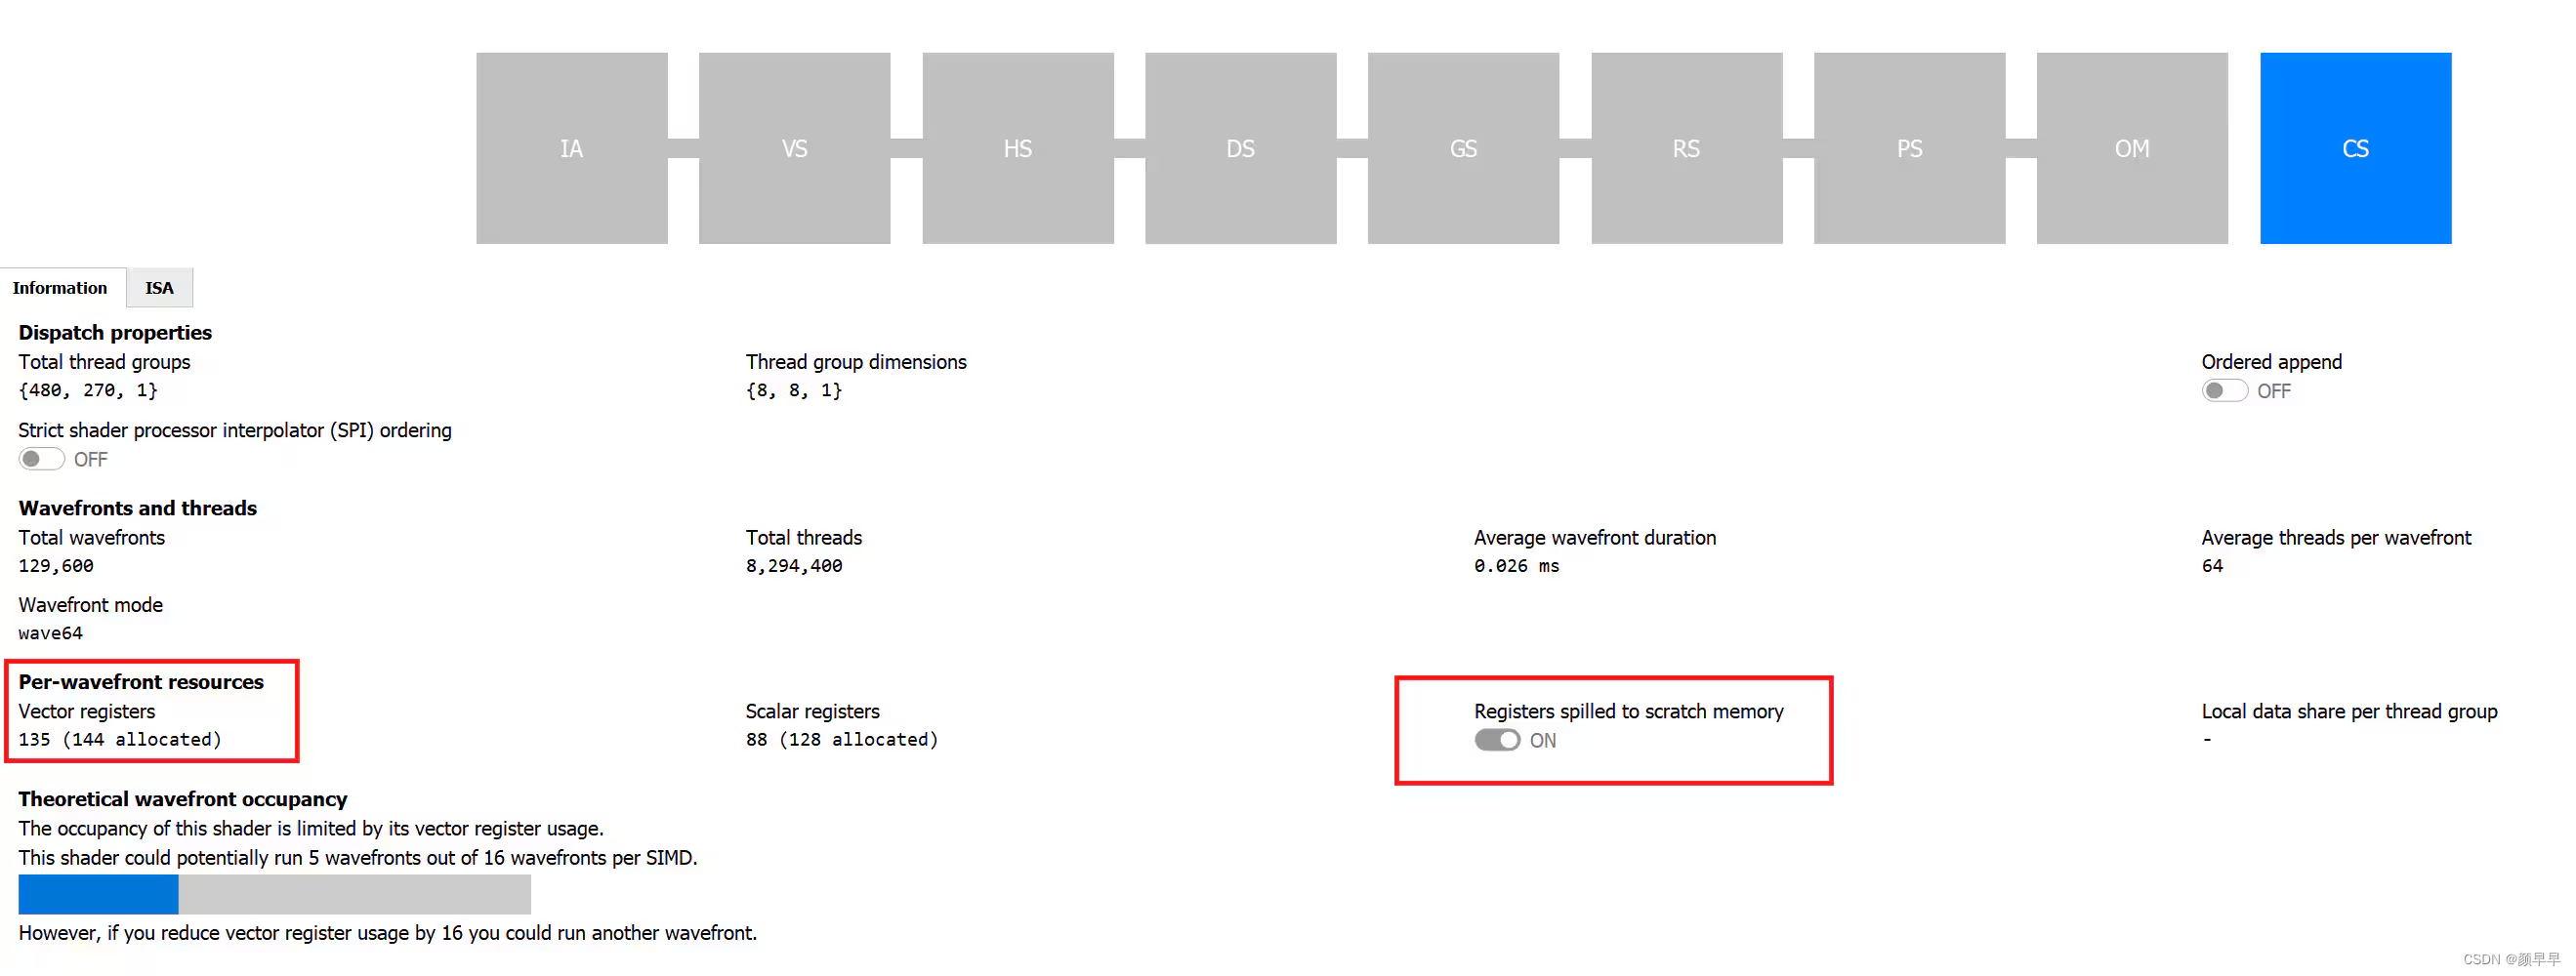
Register spilling visualization in the pipeline tab of RGP


 1526
1526

 被折叠的 条评论
为什么被折叠?
被折叠的 条评论
为什么被折叠?
 到【灌水乐园】发言


