


直方图
#numpy图像直方图显示
import numpy as np
from PIL import Image
import matplotlib.pyplot as plt
image = Image.open("erha.jpg")
img_arr = np.array(image)
#看看灰度图的直方图如何
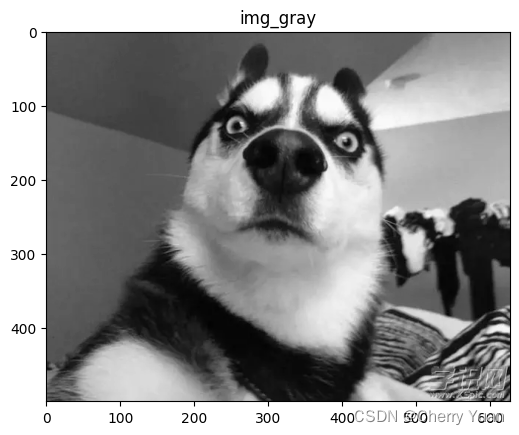
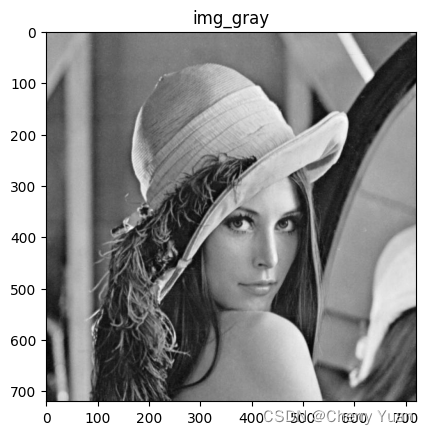
img_gray = image.convert("L")
img_gray = np.uint8(img_gray)
plt.title("img_gray")
plt.imshow(img_gray,cmap="gray")
plt.show()
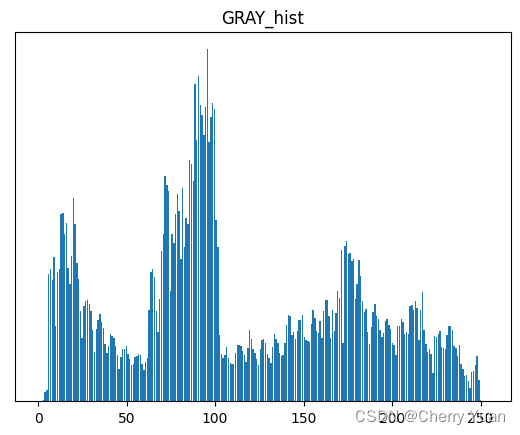
np_histogram_gray,bins_gray = np.histogram(img_gray[:,:],bins=256,range=(0,255))
plt.yticks([])
plt.title("GRAY_hist")
plt.bar(bins_gray[:-1],np_histogram_gray)
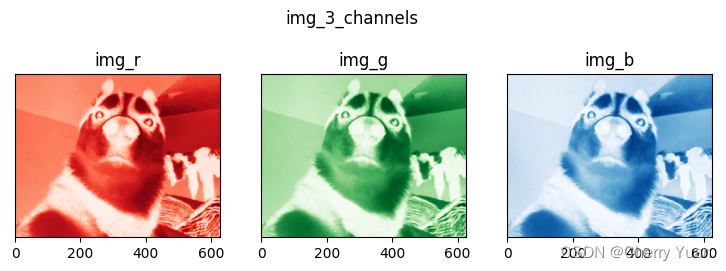
#获取图像RGB三通道的颜色值
img_r = img_arr[:,:,0]
img_g = img_arr[:,:,1]
img_b = img_arr[:,:,2]
img_r = np.uint8(img_r)
img_g = np.uint8(img_g)
img_b = np.uint8(img_b)
plt.figure(figsize=(9, 3))
plt.subplot(1,3,1)
plt.yticks([])
plt.imshow(img_r,cmap="Reds")
plt.title("img_r")
plt.subplot(1,3,2)
plt.yticks([])
plt.imshow(img_g,cmap="Greens")
plt.title("img_g")
plt.subplot(1,3,3)
plt.yticks([])
plt.imshow(img_b,cmap="Blues")
plt.title("img_b")
plt.suptitle("img_3_channels")
plt.show()
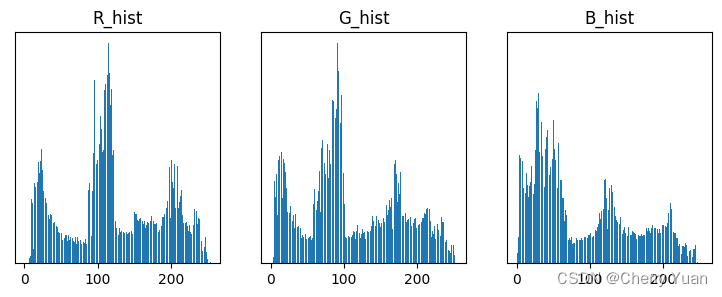
#分别获取三通道的直方图统计数据
np_histogram_r,bins_r = np.histogram(img_arr[:,:,0],bins=256,range=(0,255))
np_histogram_g,bins_g = np.histogram(img_arr[:,:,1],bins=256,range=(0,255))
np_histogram_b,bins_b = np.histogram(img_arr[:,:,2],bins=256,range=(0,255))
# print(np_histogram)
plt.figure(figsize=(9,3))
plt.subplot(131)
plt.yticks([])
plt.title("R_hist")
plt.bar(bins_r[:-1],np_histogram_r)
plt.subplot(132)
plt.yticks([])
plt.title("G_hist")
plt.bar(bins_g[:-1],np_histogram_g)
plt.subplot(133)
plt.yticks([])
plt.title("B_hist")
plt.bar(bins_b[:-1],np_histogram_b)
#注意:这里np_histogram形状为(256,),bins形状为(257,)。因此绘图时取的是bins[:-1],并不是全部元素。
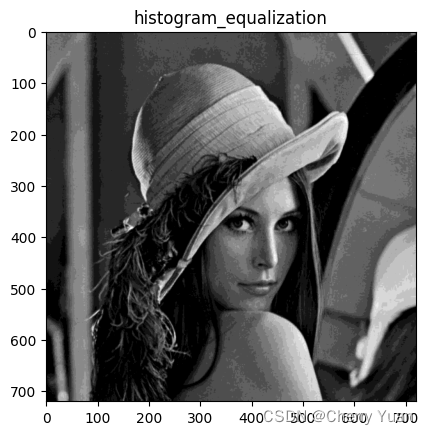
直方图均衡化
直方图均衡也成为直方图拉伸,是一种简单的图像增强技术,通过改变图像直方图分布,来改变图像中各像素的灰度,可用于增强动态范围偏小的图像的对比度。
比如原图较暗,此时原图的灰度值基本上集中于较小的范围内,通过直方图均衡的方法,可以将原图的灰度值变得均匀一些,达到对比度提升的效果。
直方图均衡化公式如下:
s
k
=
(
L
−
1
)
∑
j
=
0
k
n
j
N
s_k = (L-1)\sum_{j=0}^k \frac{n_j}{N}
sk=(L−1)j=0∑kNnj
其中
s
k
s_k
sk表示直方图均衡后,灰度级为k的对应像素;
n
j
n_j
nj表示灰度值为j的像素数;L是灰度级;N是像素总数。
#直方图均衡化
import numpy as np
import matplotlib.pyplot as plt
from PIL import Image

img = Image.open("example.jpg")
img_gray = img.convert("L")

plt.title("img_gray")
plt.imshow(img_gray,cmap="gray")
plt.show()

img_gray_arr = np.array(img_gray)
height,width = img_gray_arr.shape
# print(img_gray_arr)

np_histogram_gray,bins_gray = np.histogram(img_gray_arr[:,:],bins=256,range=(0,255))
# print(np_histogram_gray)

img_new = np.zeros((height,width))

gray_level = [0] * 256

#遍历所有灰度级数,计算累积的像素灰度级数
for i in range(256):
    if i == 0:
        gray_level[i] = bins_gray[i]
    else:
        gray_level[i] = gray_level[i-1] + bins_gray[i]

# print(gray_level)

#计算累计像素数量
for i in range(height):
    for j in range(width):
        img_new[i][j] = (gray_level[img_gray_arr[i][j]] / (height * width)) * 255

# np_histogram_new,bins_new = np.histogram(img_new[:,:],bins=256,range=(0,255))
# print(np_histogram_new)

img_new = np.uint8(img_new)

plt.title("histogram_equalization")
plt.imshow(img_new,cmap="gray")
plt.show()


 4万+
4万+

 被折叠的 条评论
为什么被折叠?
被折叠的 条评论
为什么被折叠?
 到【灌水乐园】发言


