


 本文介绍了在PyCharm和VSCode中配置环境,以实现C++与Python的混合编程调试,特别关注了pybind11示例项目,以及如何通过gdb进行高效性能优化的技巧。
参考文档
- https://github.com/bast/pybind11-demo
- https://www.jetbrains.com/help/clion/attach-to-process.html
- https://nadiah.org/2020/03/01/example-debug-mixed-python-c-in-visual-studio-code/
简要说明
- 我遇到这个技术的场景是使用cpp的各种kernel加速py cv的部分
- 这种方式属于高风险,高收入的方案,平时应当尽量减少使用,避免不必要的bug
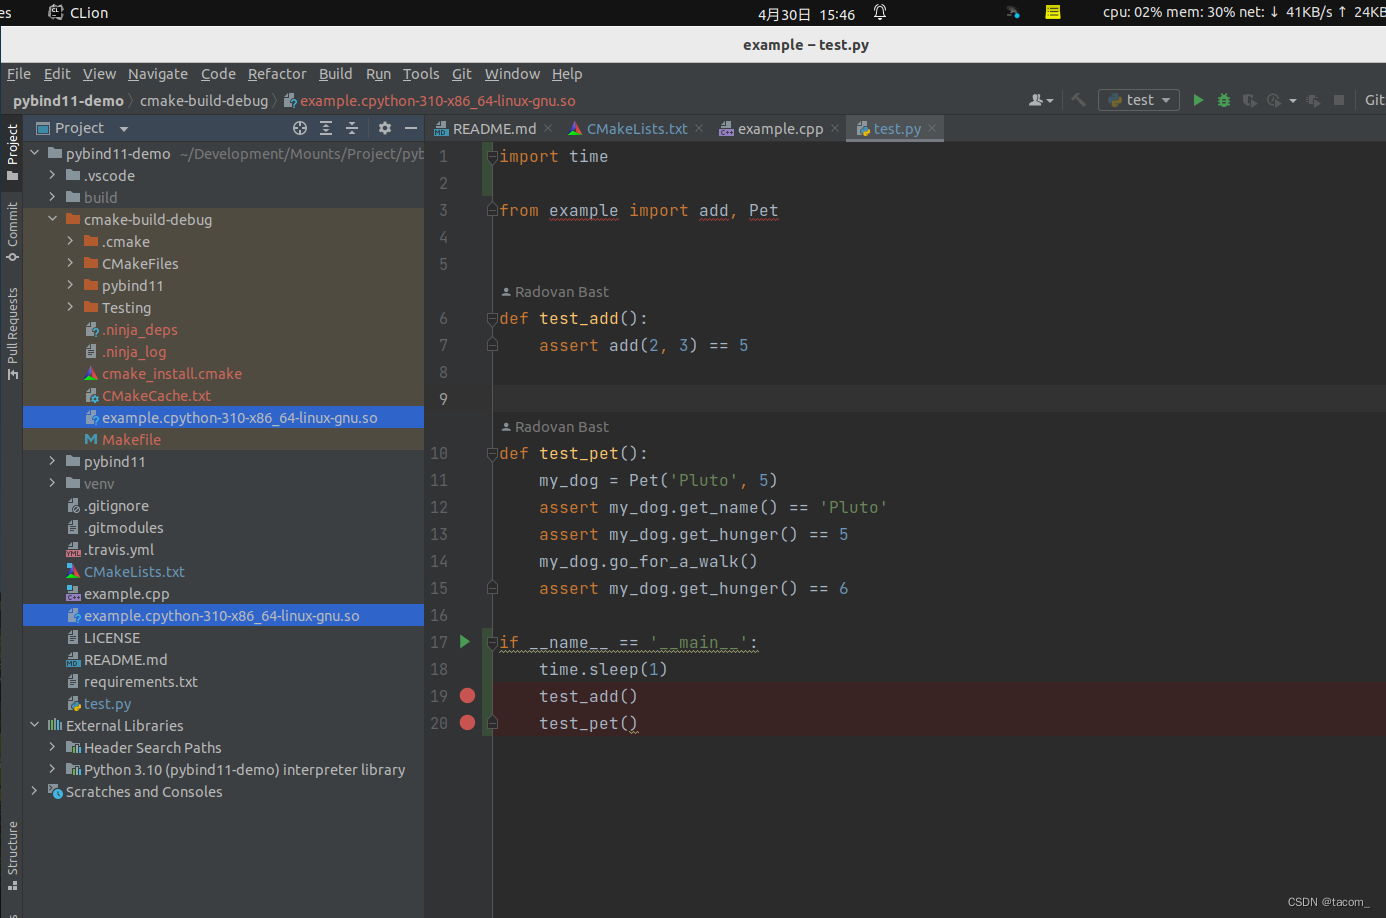
pycharm环境配置(py)
这里默认你安装了pycharm, vscode
pycharm可以是任何py的开发sdk,这里用于方便区分
安装了c/cpp的基础开发环境: cmake, build-essentials之类的
- 关闭Linux的一些权限,否则不同进程attach会权限不足
echo 0 | sudo tee /proc/sys/kernel/yama/ptrace_scope
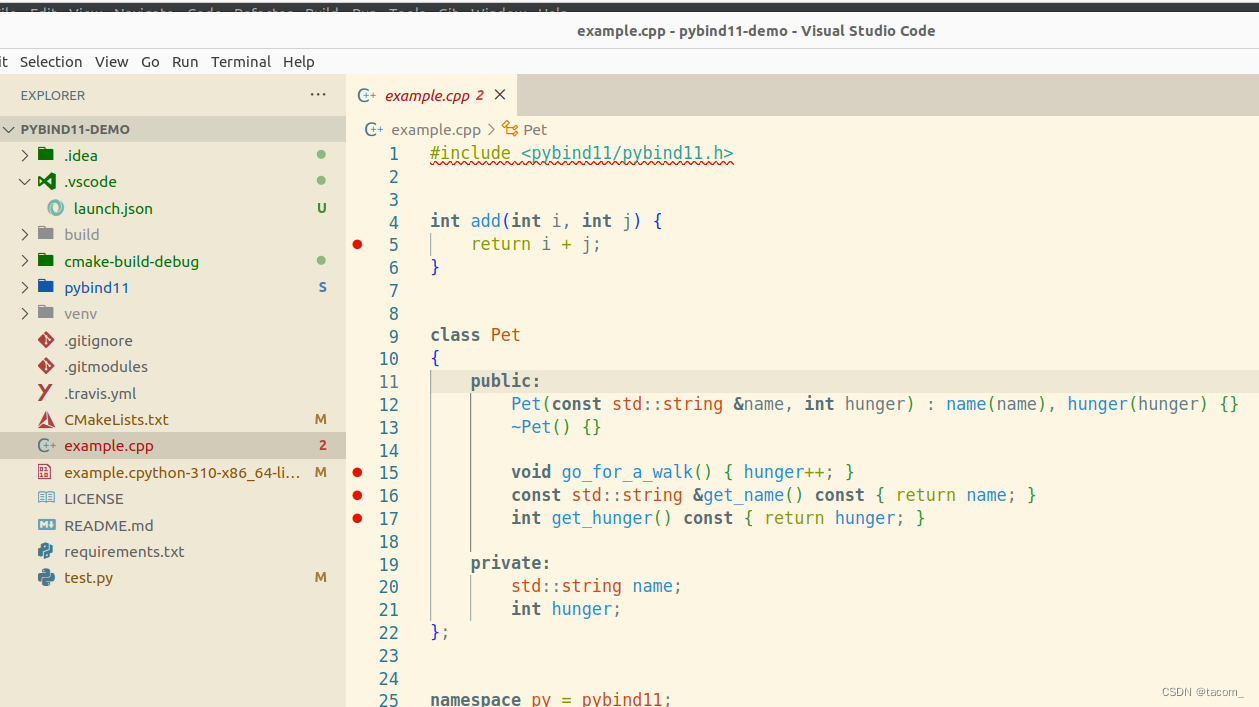
- 编译示例项目pybind11-demo.git
-
 git clone --recursive https://github.com/bast/pybind11-demo.git
 cd pybind11-demo
 mkdir build
 cd build
 cmake ..
 make
-
- 将编译生成的混编文件放到test.py同级目录
vscode环境配置(cpp)
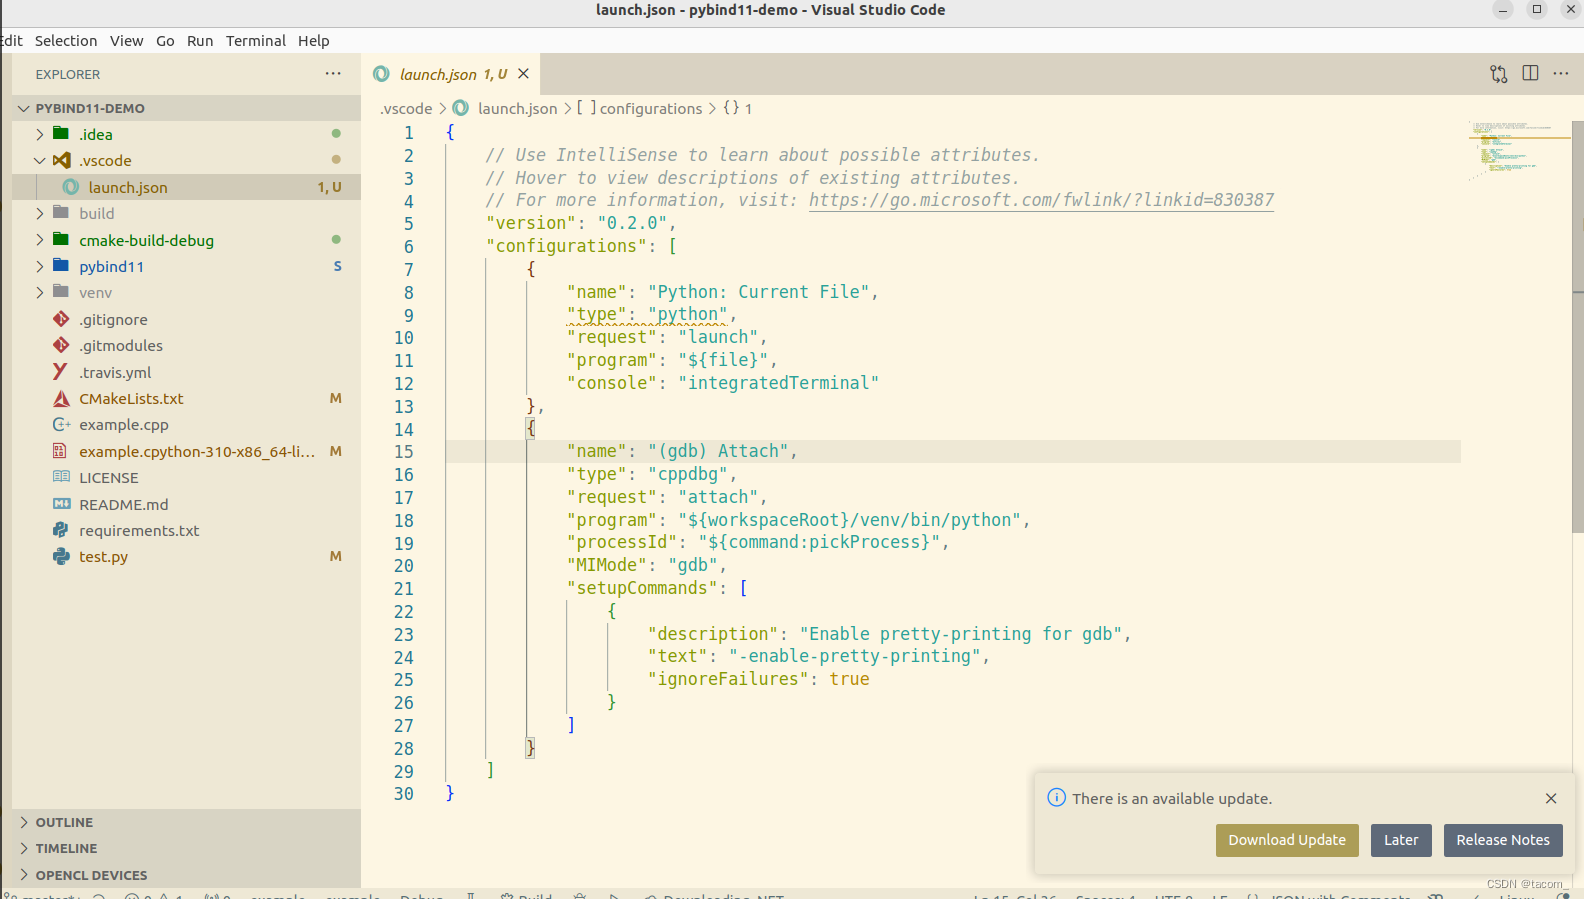
新建一个launch.json, 编码如下:
{
    // Use IntelliSense to learn about possible attributes.
    // Hover to view descriptions of existing attributes.
    // For more information, visit: https://go.microsoft.com/fwlink/?linkid=830387
    "version": "0.2.0",
    "configurations": [
        {
            "name": "Python: Current File",
            "type": "python",
            "request": "launch",
            "program": "${file}",
            "console": "integratedTerminal"
        },
        {
            "name": "(gdb) Attach",
            "type": "cppdbg",
            "request": "attach",
            "program": "${workspaceRoot}/venv/bin/python",
            "processId": "${command:pickProcess}",
            "MIMode": "gdb",
            "setupCommands": [
                {
                    "description": "Enable pretty-printing for gdb",
                    "text": "-enable-pretty-printing",
                    "ignoreFailures": true
                }
            ]
        }
    ]
}
开始调试
1. 启动py调试器
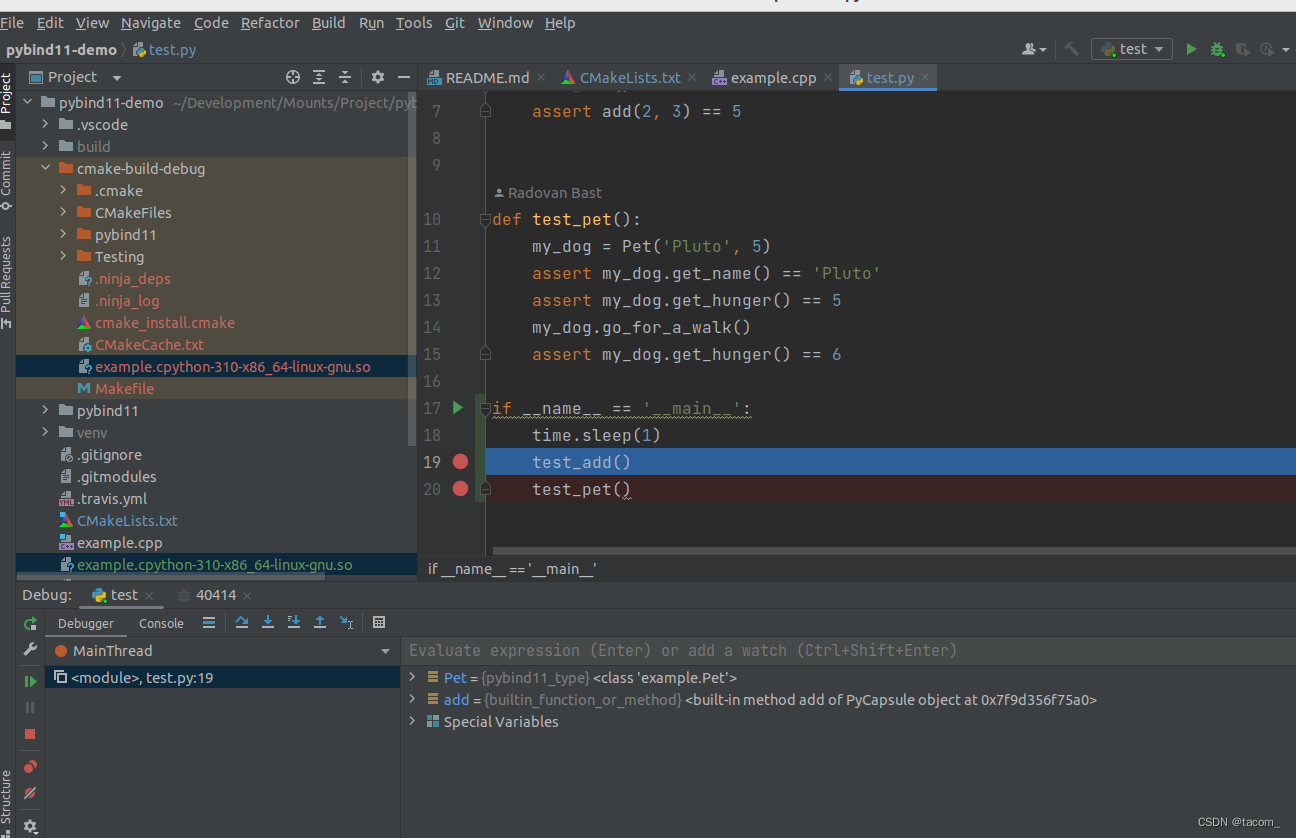
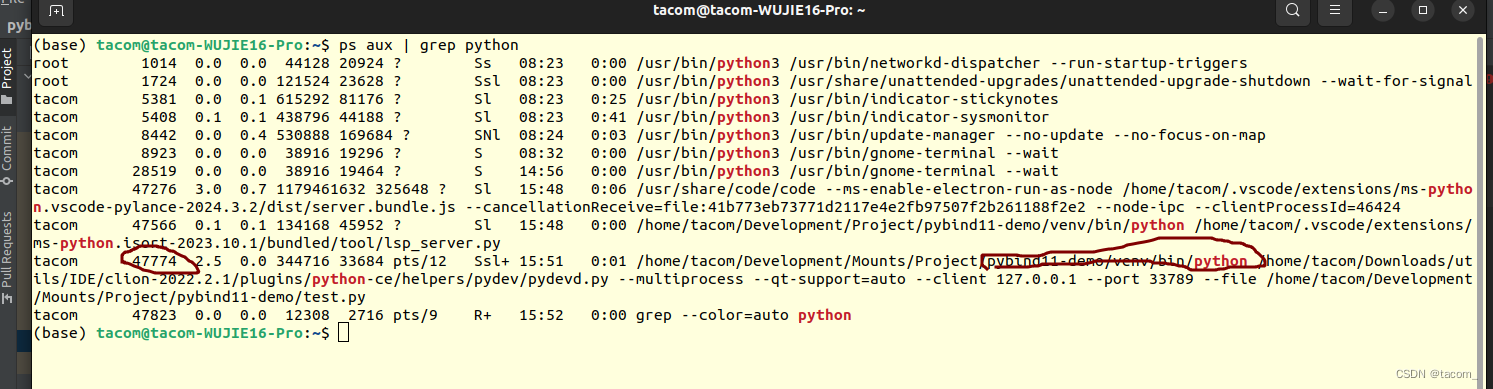
2. 查看对应的pid
3. vscode打好断点
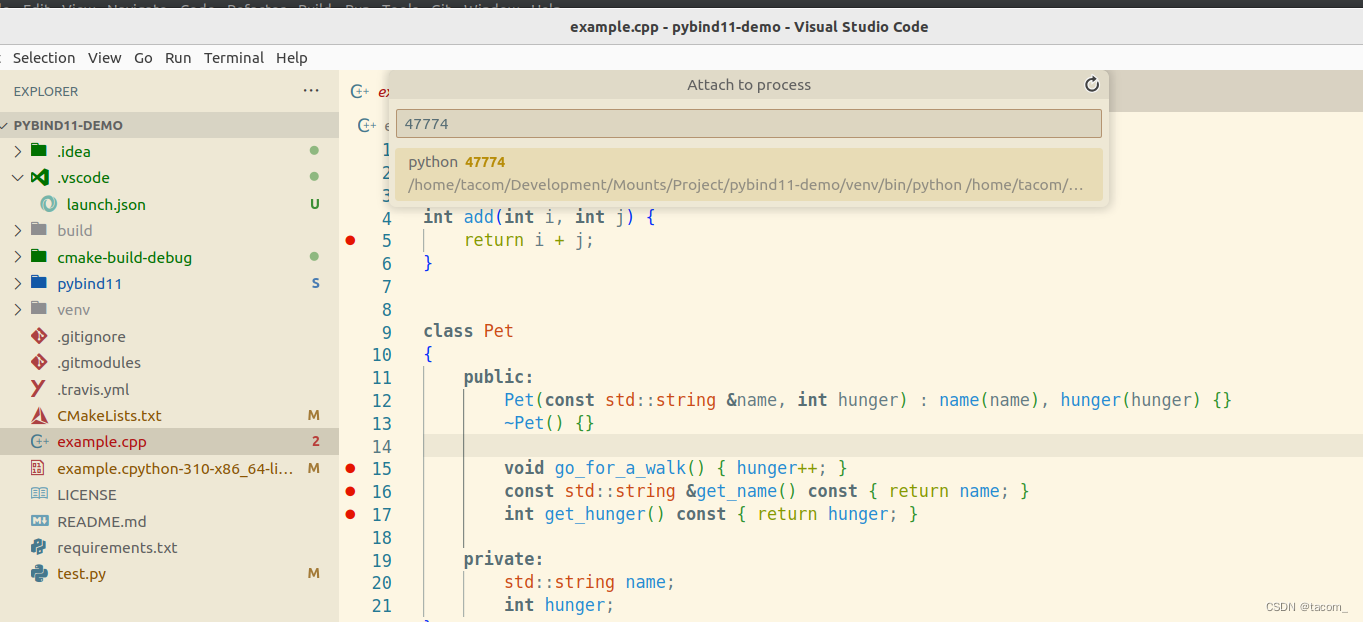
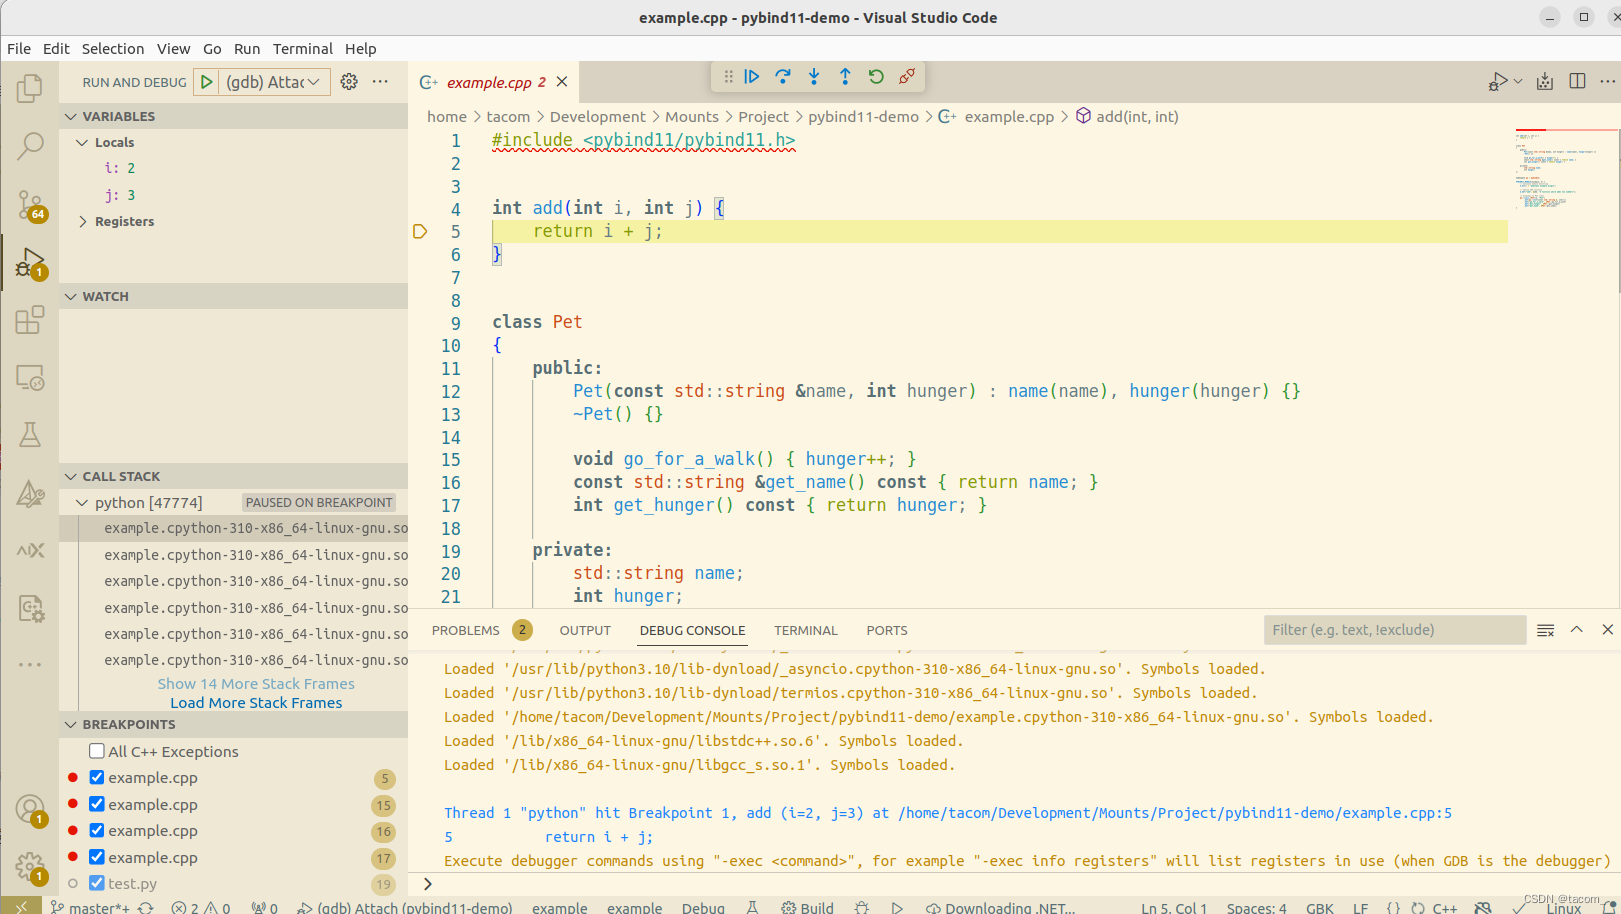
4. gdb attach
- 按下F5输入pid后就行链接到python进程了
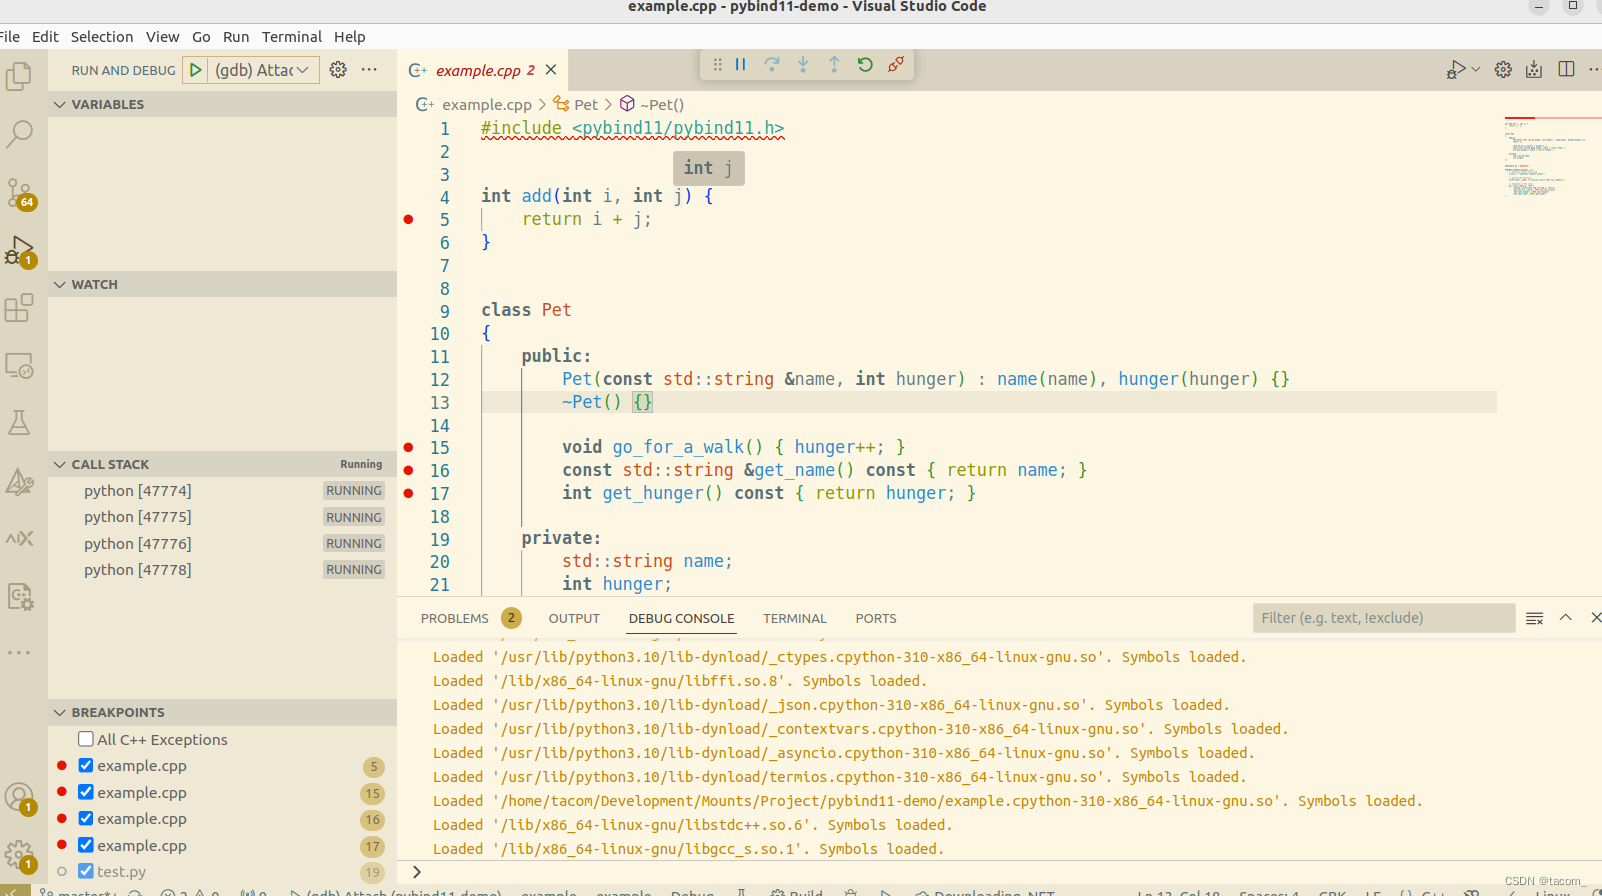
5. 单步调试
- pycharm单步调试后,一会后vscode就会触发断点
结语
- 这里是最简化的调试方式,实际上还要设定gdb的sourcemap, 比如opencv的头文件位置
- 这种混合编程的方式通常只适用于性能需求点,如何要求不高应该采用命令行方式,方便编程


 571
571

 被折叠的 条评论
为什么被折叠?
被折叠的 条评论
为什么被折叠?
 到【灌水乐园】发言


