


springboot配置
- build.gradle.kts
	implementation("org.springframework.boot:spring-boot-starter-actuator:2.6.4")
    implementation("io.micrometer:micrometer-registry-prometheus:1.8.3")
- application.yml
management:
  metrics:
    export:
      prometheus:
        enabled: true
    tags:
      application: ${spring.application.name}
  endpoints:
    web:
      exposure:
        include: "*"
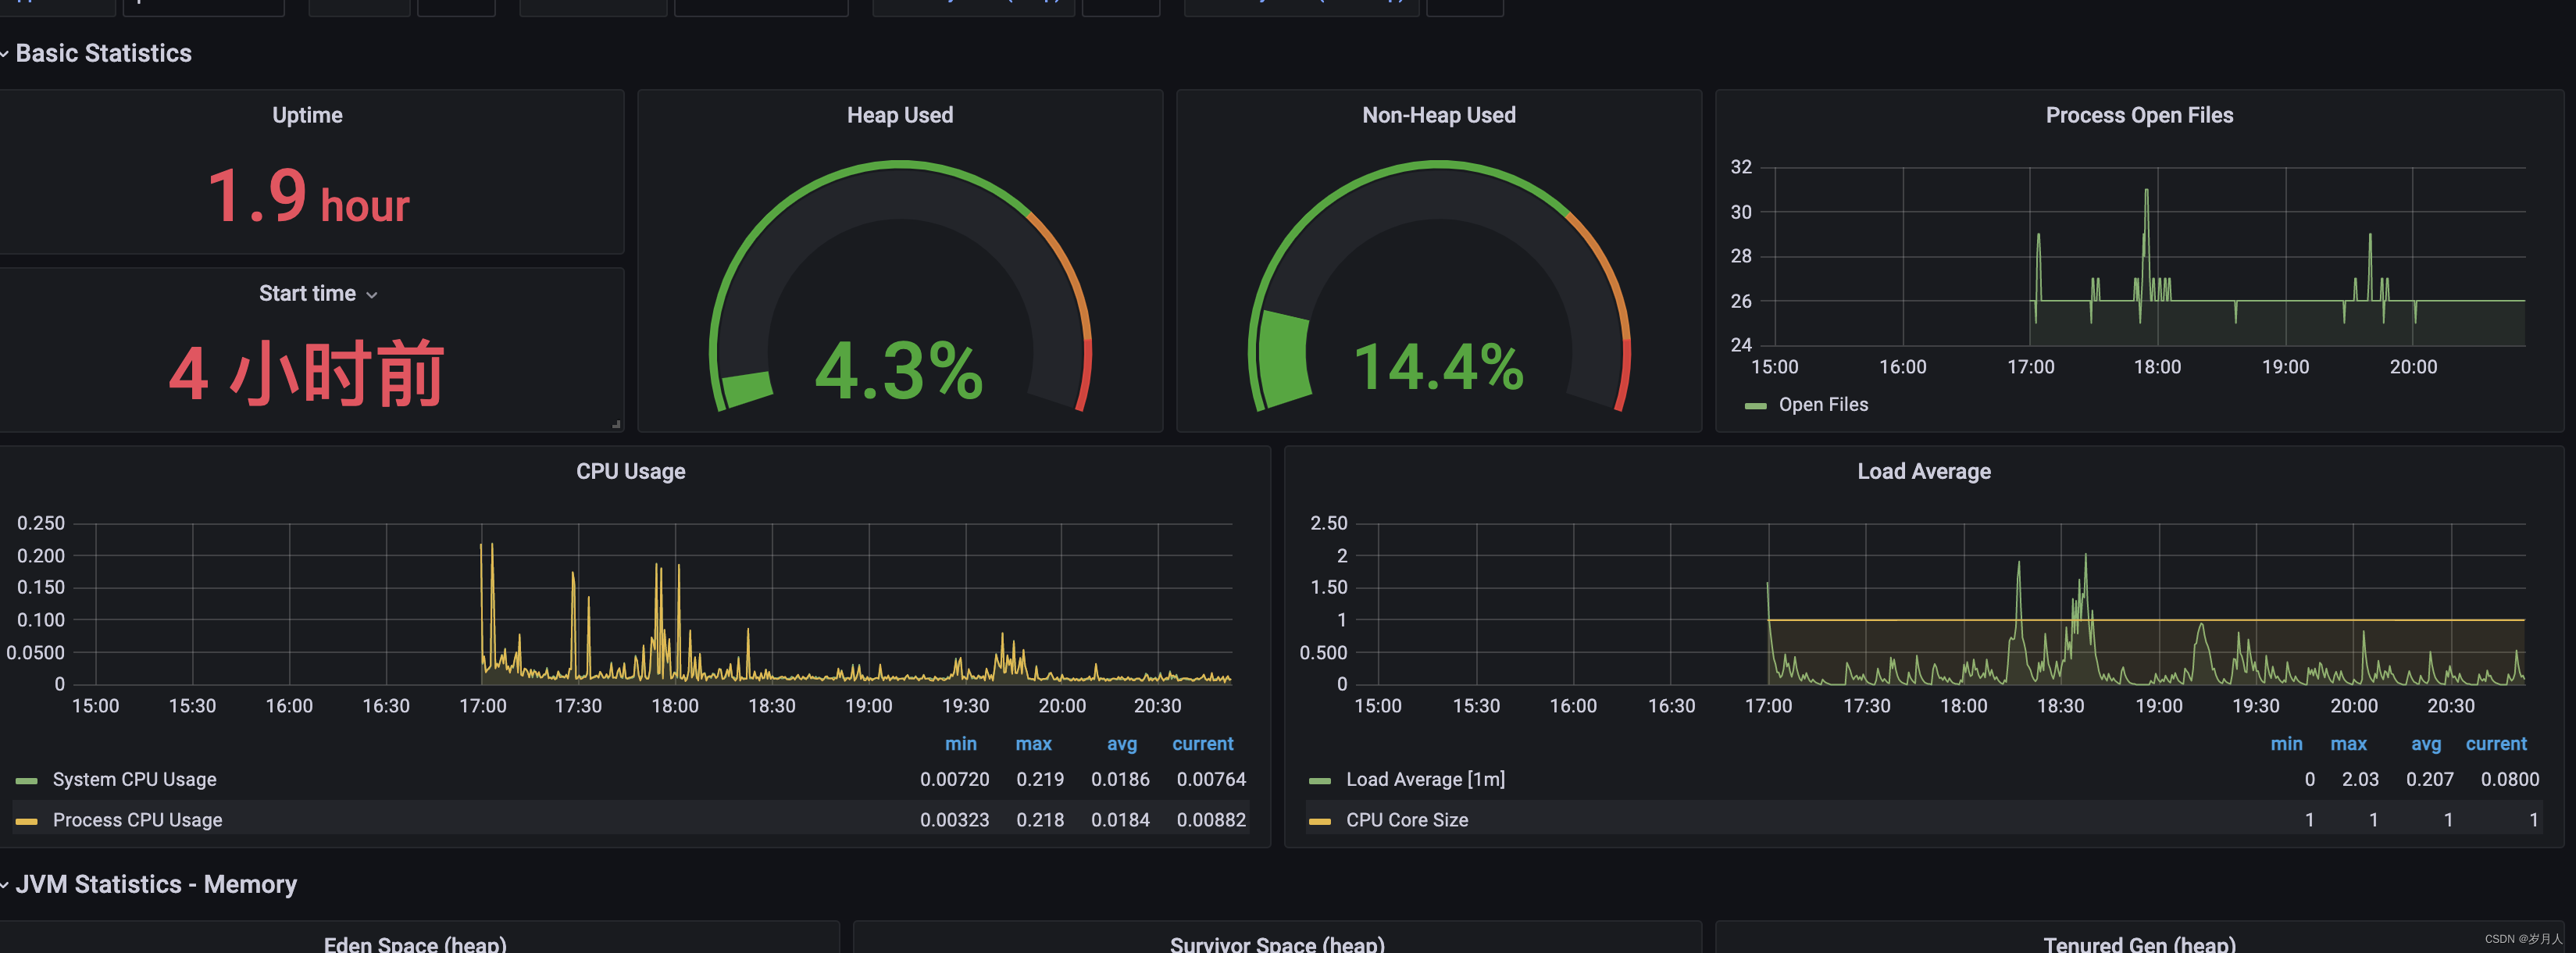
grafana配置
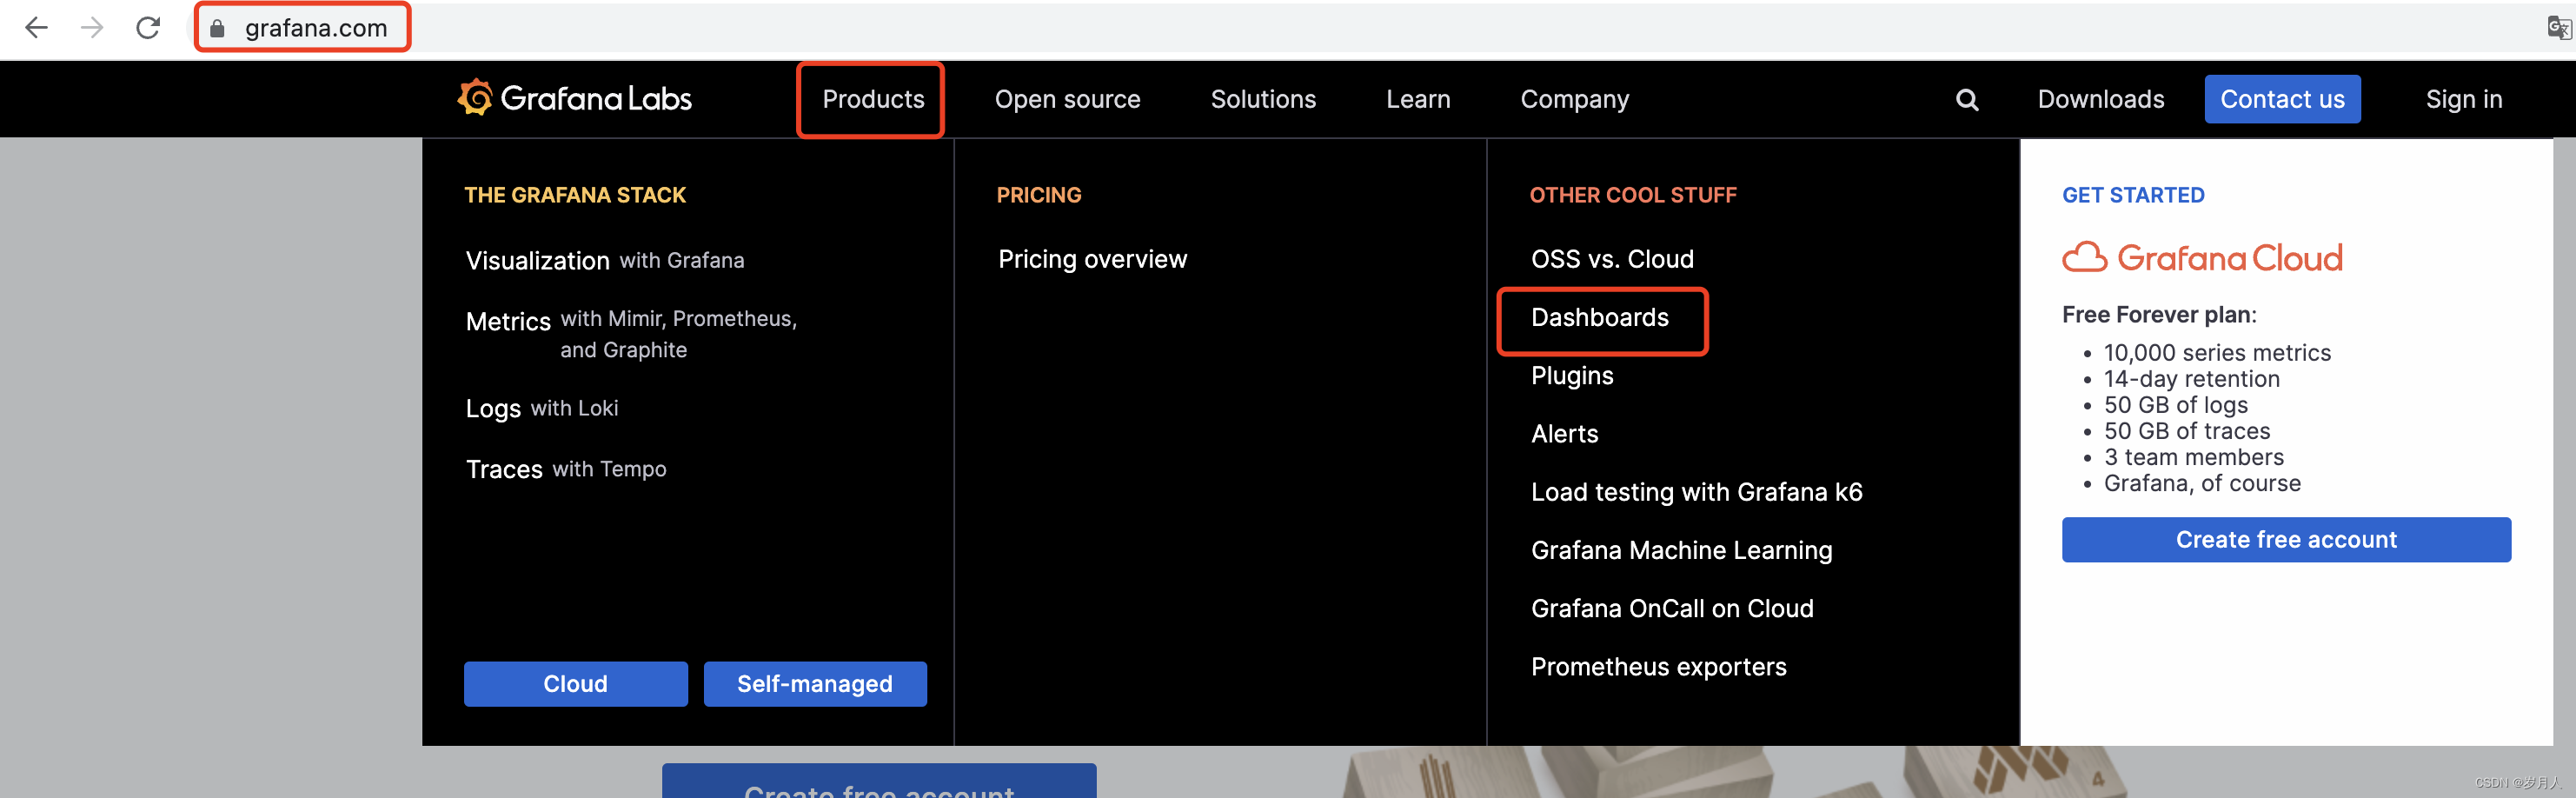
- 打开官网
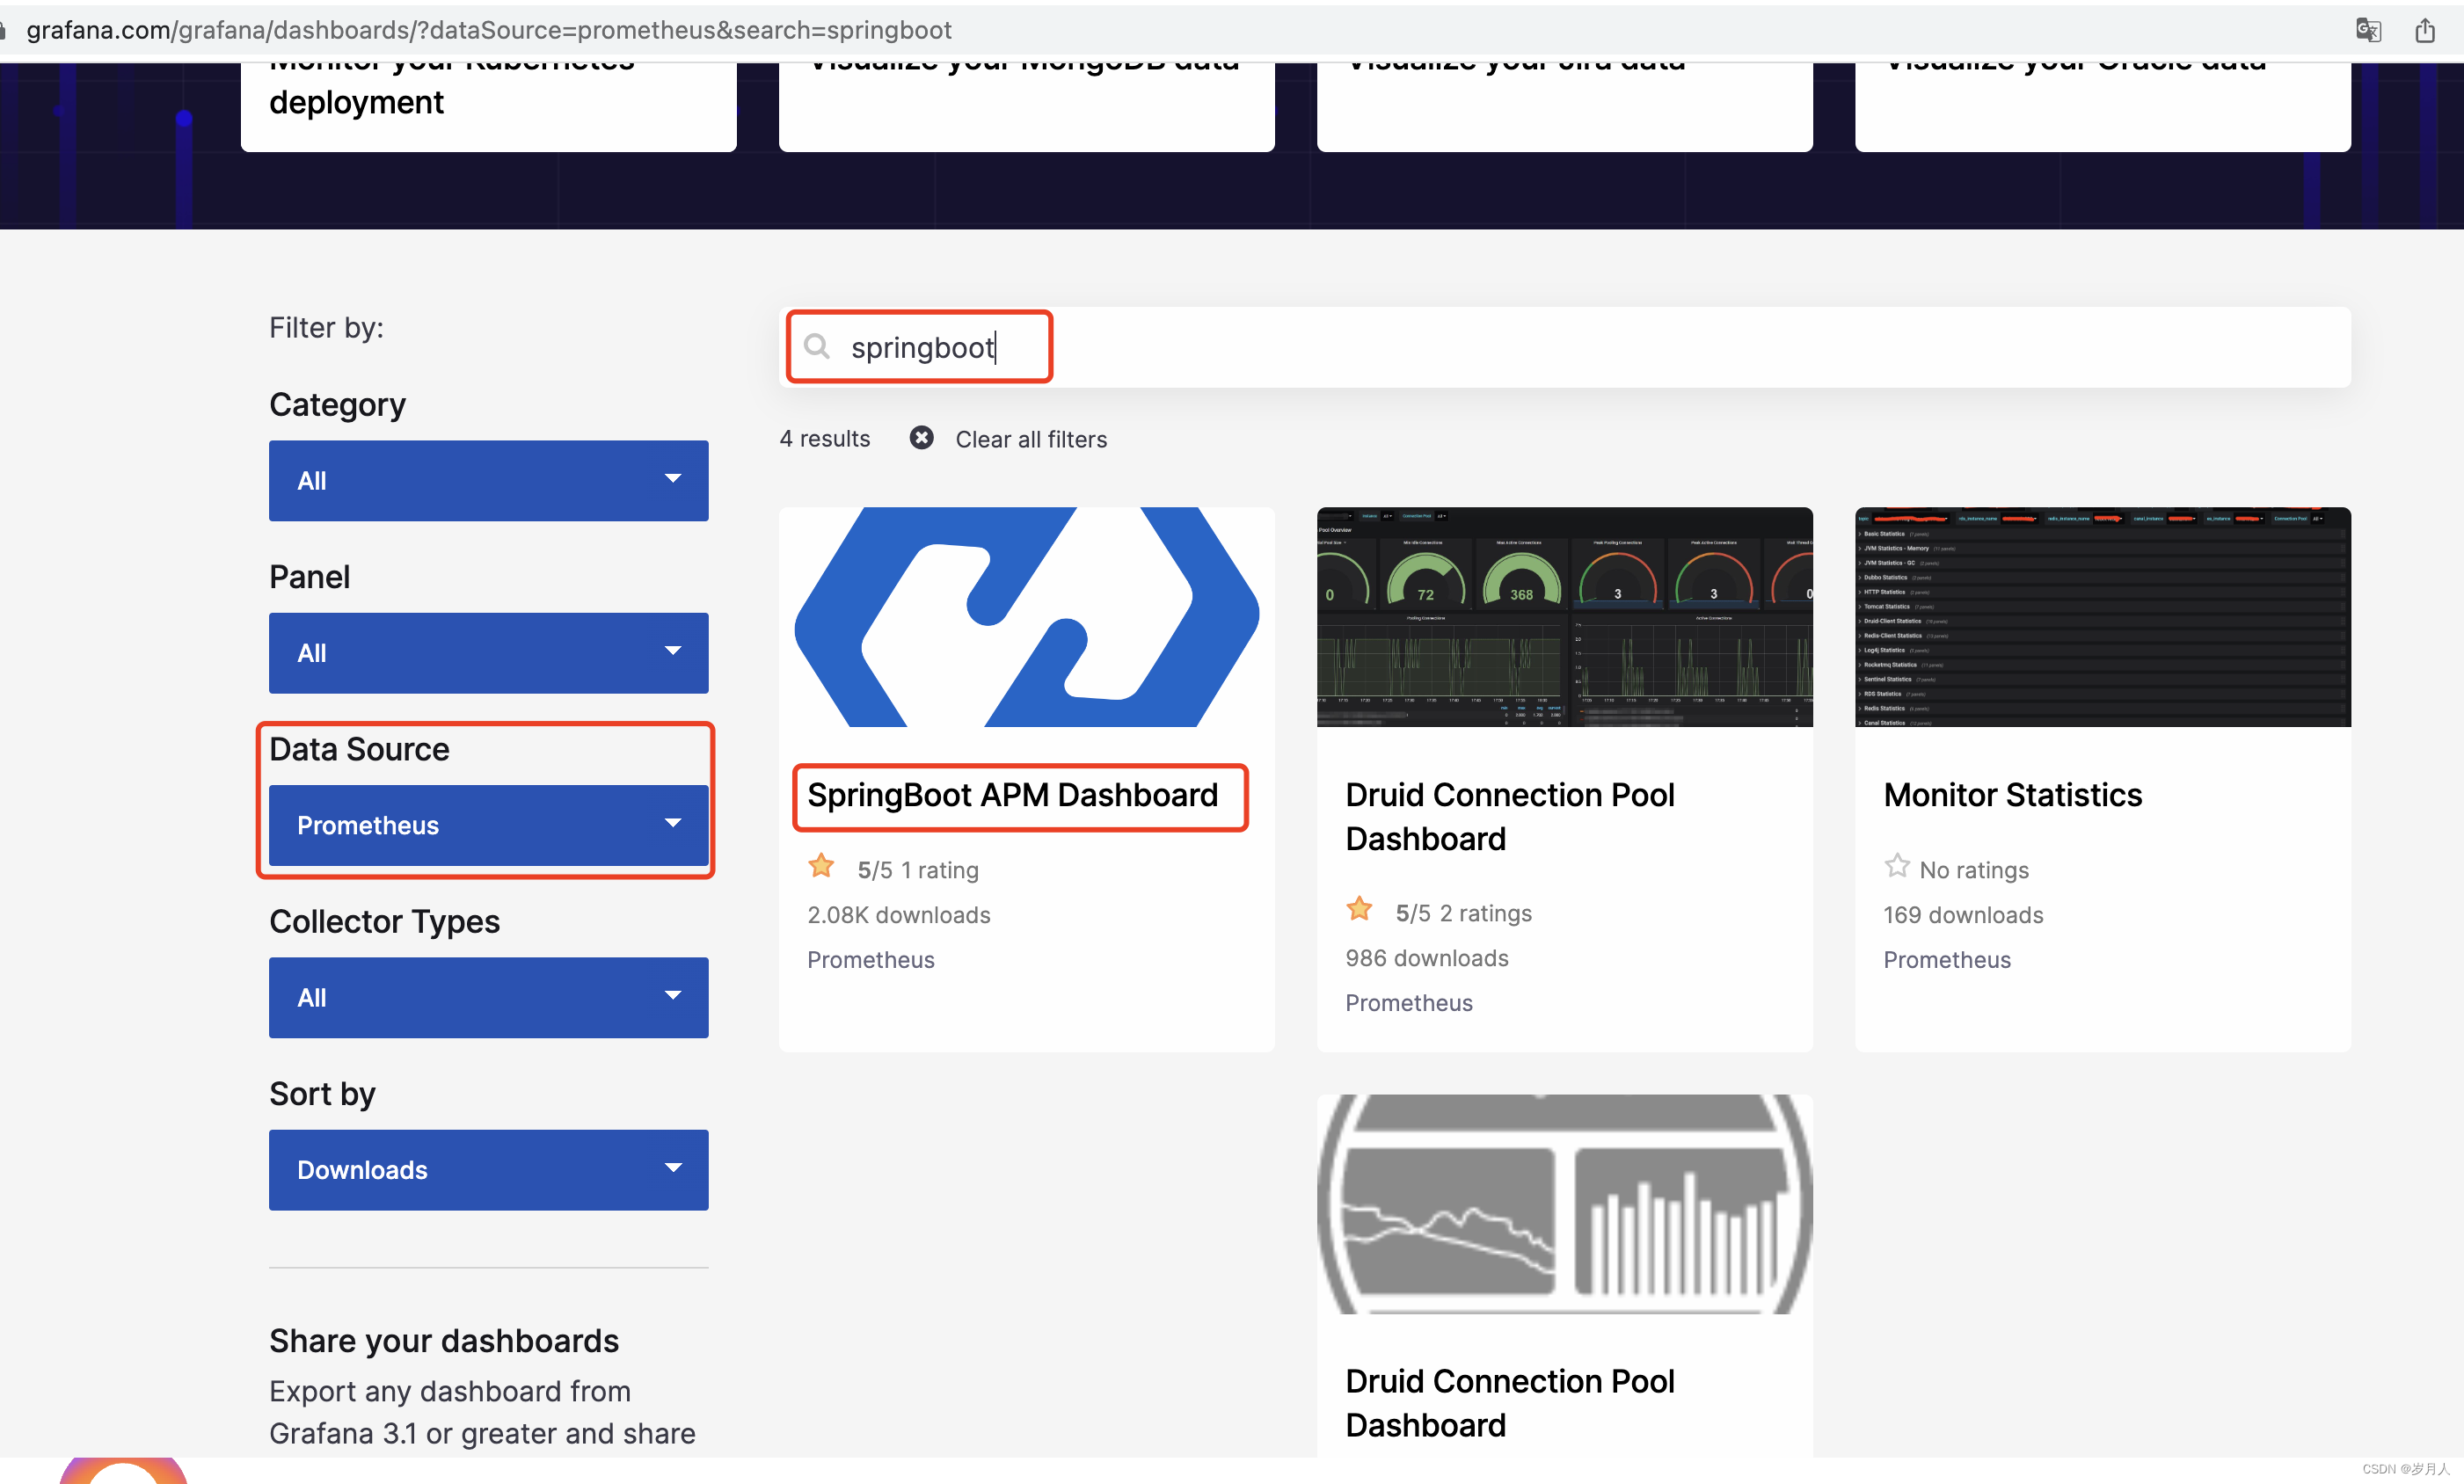
- 搜索模板
- 复制模板唯一编号
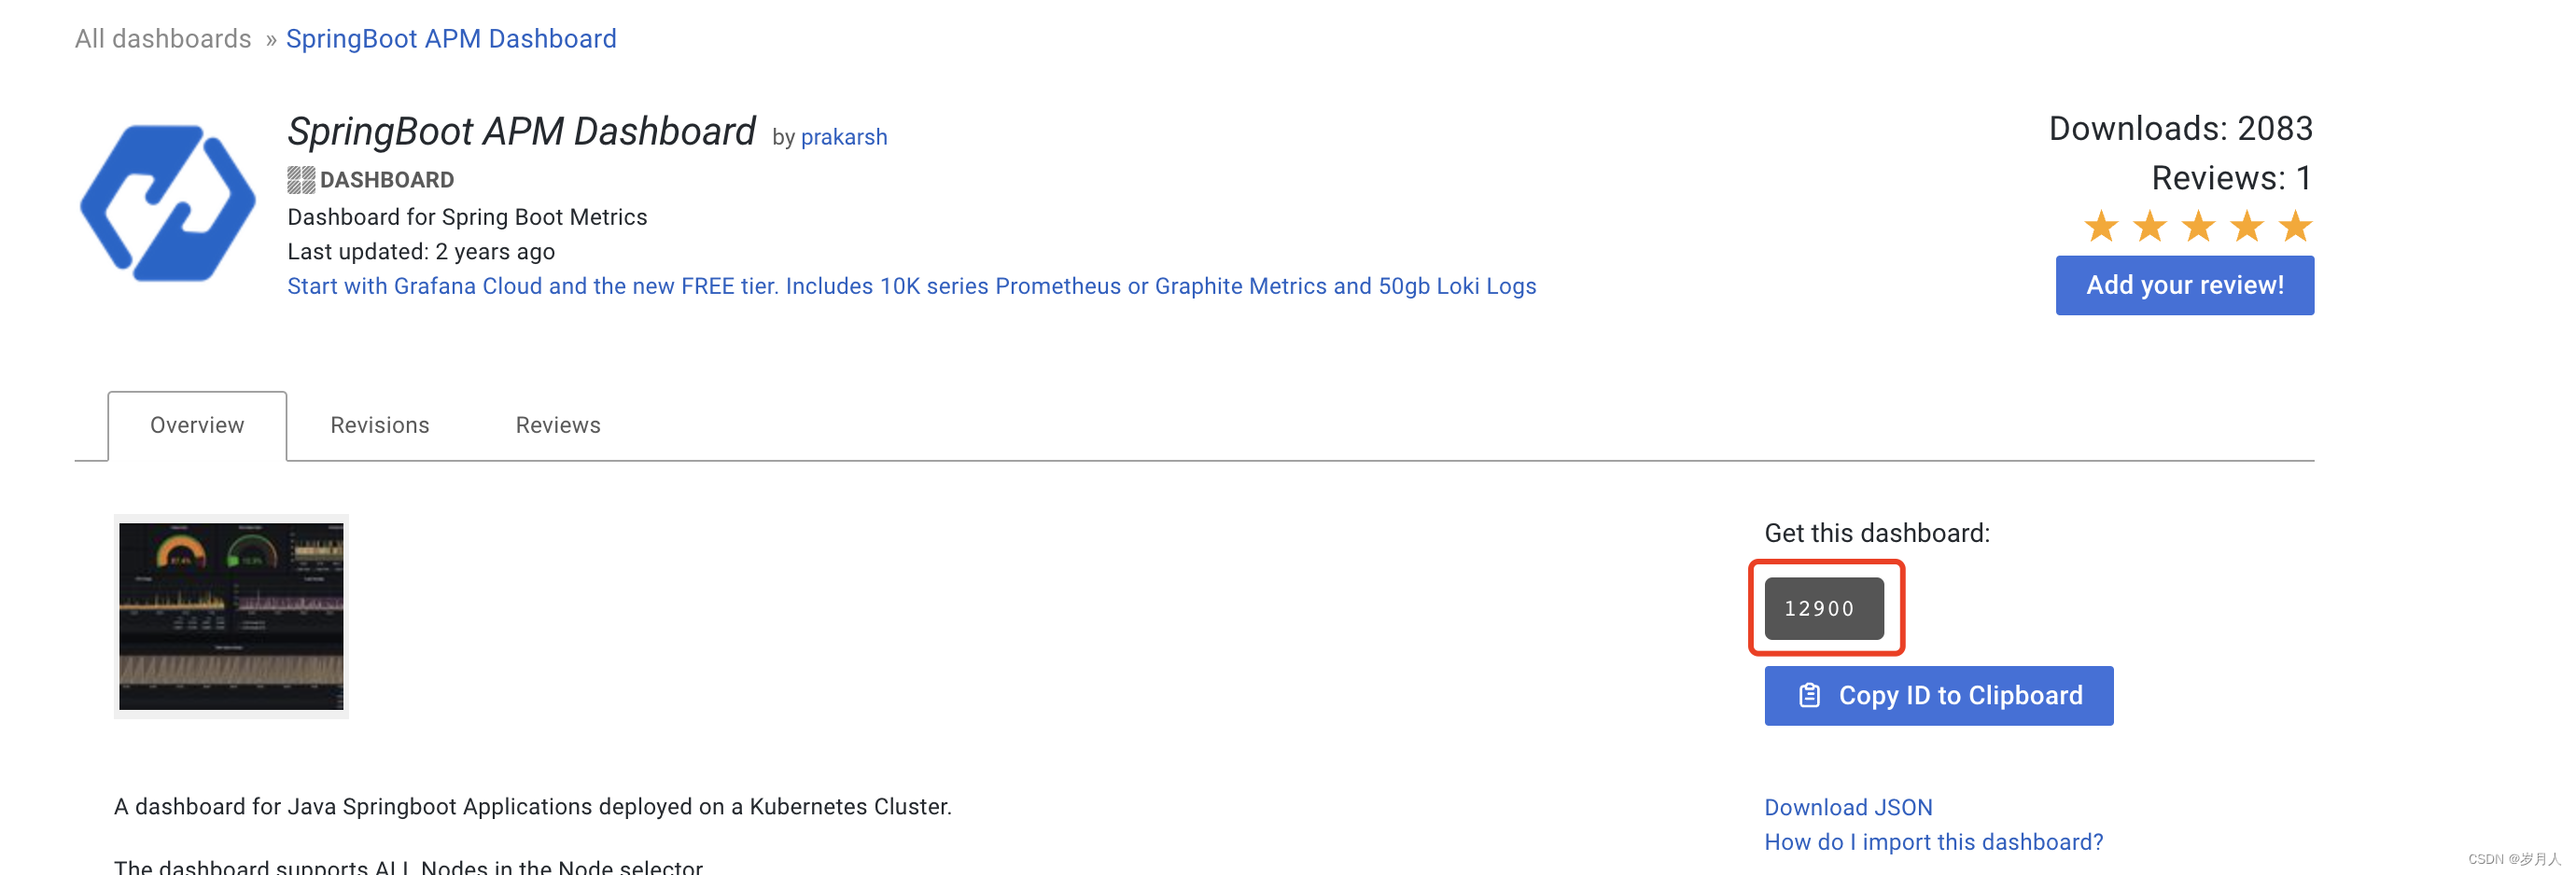
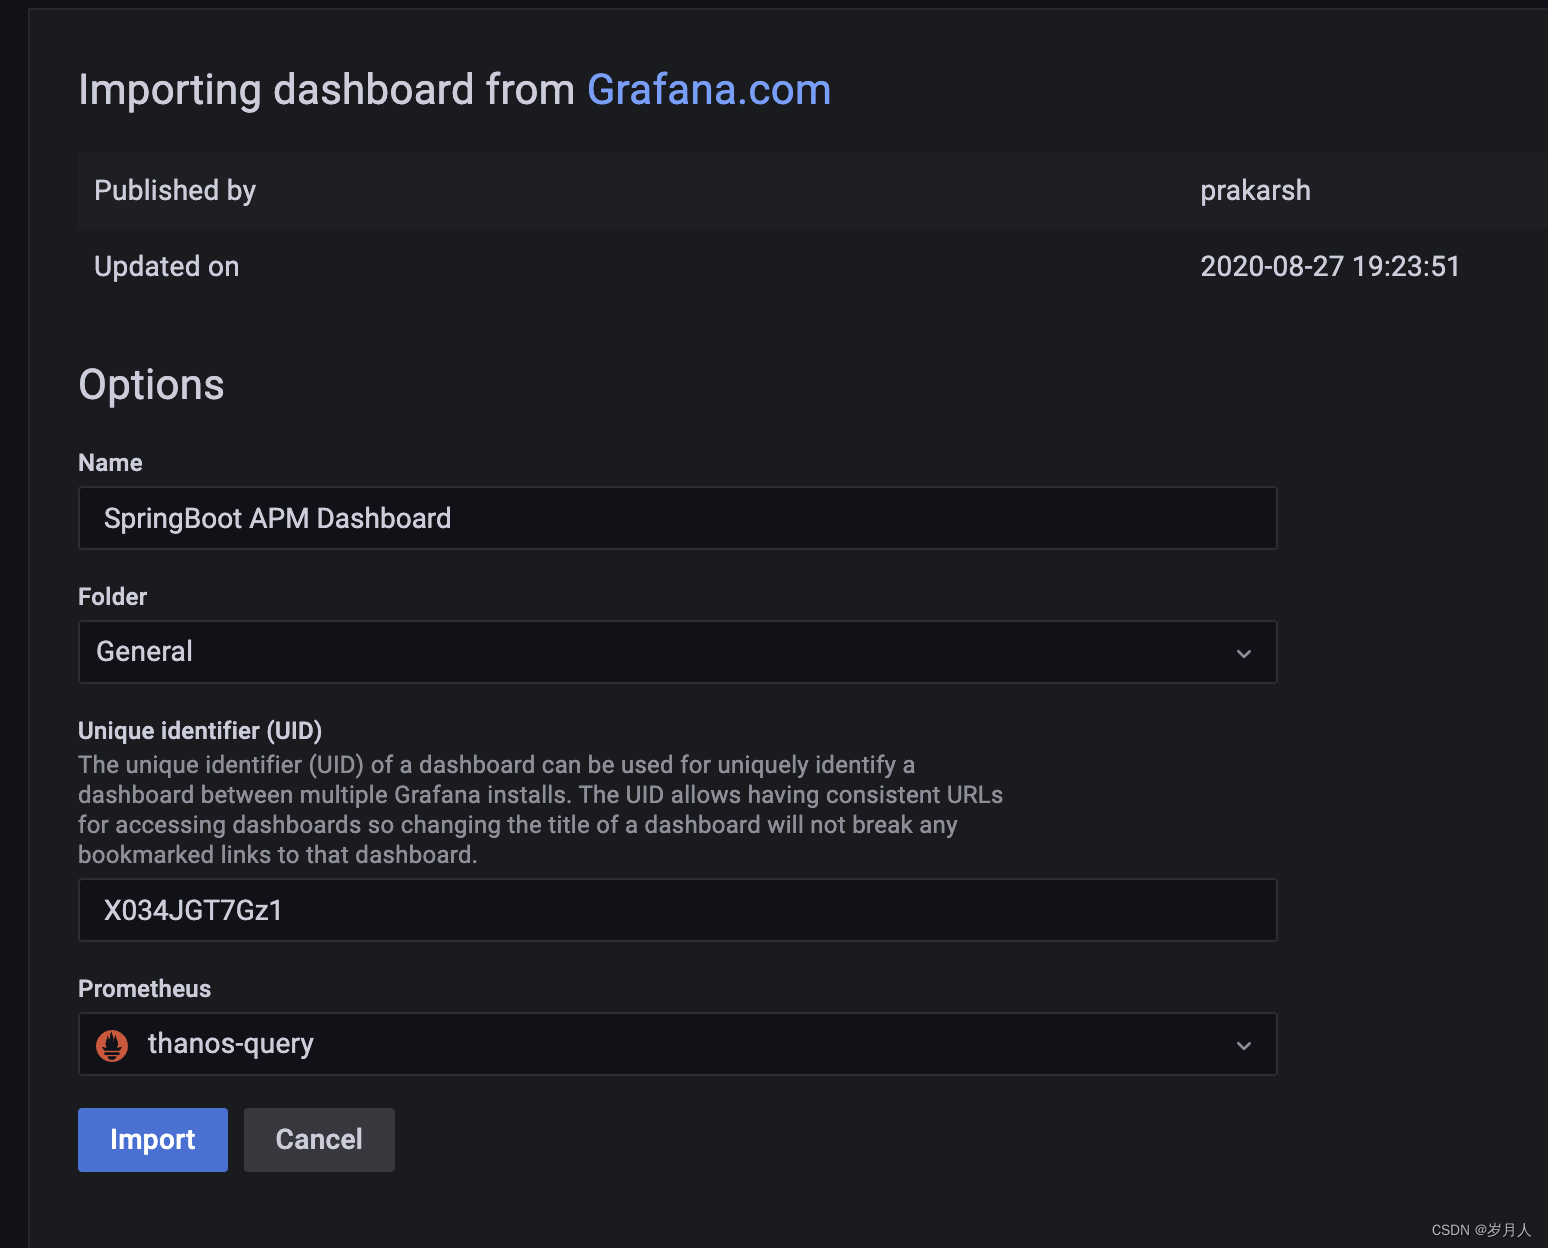
- 配置模板【输入12900,点击load】

- 加载模板,点击import生成看板
prometheus配置
 - job_name: job_springboot # 任务名称
    metrics_path: '/actuator/prometheus' # 后台通过actuator暴露的URI
    static_configs:
      - targets: ['192.168.211.1:9121'] # 后台IP和PORT
        labels:
          instance: application-springboot # 实例名称


 1702
1702


 被折叠的 条评论
为什么被折叠?
被折叠的 条评论
为什么被折叠?
 到【灌水乐园】发言


