


1. 字体设置
matplotlib默认的字体其实我个人感觉不是很好看,而且导出之后贴到论文中有时候字体不符,导致一些细节上的问题。因此,我记录一下常用的matplotlib字体设置方法。它分为两个部分:一个是全局字体,plot或者scatter之后输出的图片上的所有字体的样式;再一个就是局部的,在全局的字体的基础上,设置局部(比如title、x轴、y轴、刻度啥的)字体。其中,局部的优先级是大于全局的,也就是局部设置的字体会被优先显示。这样,matplotlib生成的图就更加好看。
全局
from matplotlib import pyplot as plt
# 全局
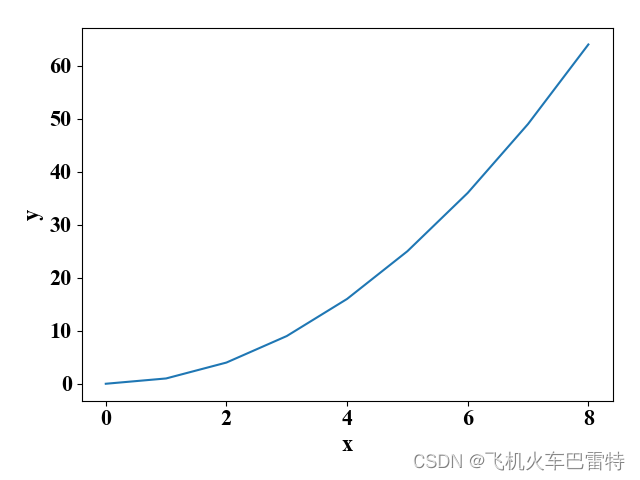
plt.rc('font', family='Times New Roman', size=16)
# 绘制
x = [0.0, 1.0, 2.0, 3.0, 4.0, 5.0, 6.0, 7.0, 8.0]
y = [0.0, 1.0, 4.0, 9.0, 16.0, 25.0, 36.0, 49.0, 64.0]
plt.xlabel('x')
plt.ylabel('y')
plt.plot(x, y)
plt.show()效果
局部
from matplotlib import pyplot as plt

# 全局
plt.rc('font', family='Times New Roman', size=16)
# 局部
ax_font = {'family': 'Times New Roman', 'size': 16, 'style': 'italic'}
# 绘制
x = [0.0, 1.0, 2.0, 3.0, 4.0, 5.0, 6.0, 7.0, 8.0]
y = [0.0, 1.0, 4.0, 9.0, 16.0, 25.0, 36.0, 49.0, 64.0]
# 设置局部字体
plt.xlabel('x', fontdict=ax_font)
plt.ylabel('y', fontdict=ax_font)
plt.plot(x, y)
plt.show()
效果

2. 图中显示希腊字母
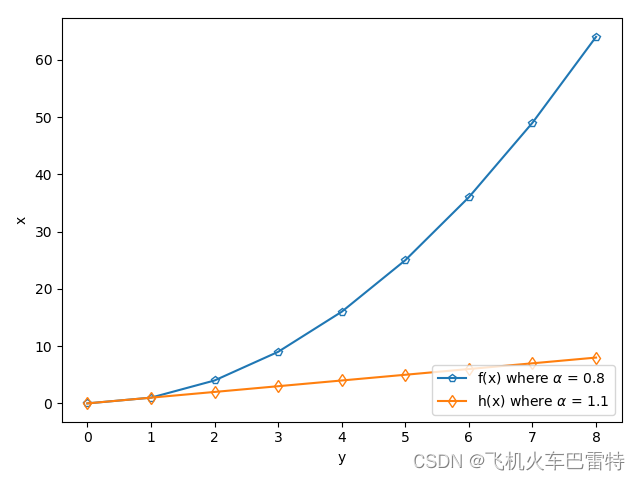
一般来说,论文有时候带有一些公式,而这些公式中通常包含希腊字母,这个时候,我们就特别需要在matplotlib绘制的图显示希腊字母了。思路主要是使用r这个转义字符。
代码
import matplotlib.pyplot as plt

x = [0.0, 1.0, 2.0, 3.0, 4.0, 5.0, 6.0, 7.0, 8.0]
y1 = [0.0, 1.0, 4.0, 9.0, 16.0, 25.0, 36.0, 49.0, 64.0]
y2 = [0.0, 1.0, 2.0, 3.0, 4.0, 5.0, 6.0, 7.0, 8.0]
# r"$\alpha$"可以显示希腊字母,不能忽略r这个字母
plt.plot(x, y1, label=r"f(x) where $\alpha$ = 0.8", marker="p", mfc="none")
plt.plot(x, y2, label=r"h(x) where $\alpha$ = 1.1", marker="d", mfc="none")
plt.legend(loc=4)
plt.xlabel("y")
plt.ylabel("x")
plt.show()
效果
3. matplotlib生成svg图片
svg是一种图像文件格式,全称为Scalable Vector Graphics,为可缩放的矢量图形。
代码
import matplotlib.pyplot as plt

x = [0.0, 1.0, 2.0, 3.0, 4.0, 5.0, 6.0, 7.0, 8.0]
y = [0.0, 1.0, 4.0, 9.0, 16.0, 25.0, 36.0, 49.0, 64.0]
plt.scatter(x, y)
# 保存为svg图片
plt.savefig(fname="temp.svg", format="svg")
plt.show()
效果(会生成py文件同一个目录之下,左边是"temp.svg"这个文件,右边是预览图)

svg图片转化为eps图片:SVG2EPS。其中,eps格式的图片也是矢量图,它的优点有:文件很小;图像可以无限级缩放,而不会产生锯齿效果;可采用高分辨率印刷。但是也有缺点:很难表现出色彩层次丰富的逼真图像效果。一般来说,为了使论文更加清晰可见,我们需要在论文里面使用eps格式图片,尤其是在LaTeX写的论文。
4. 隐藏图中的上边框和右边框
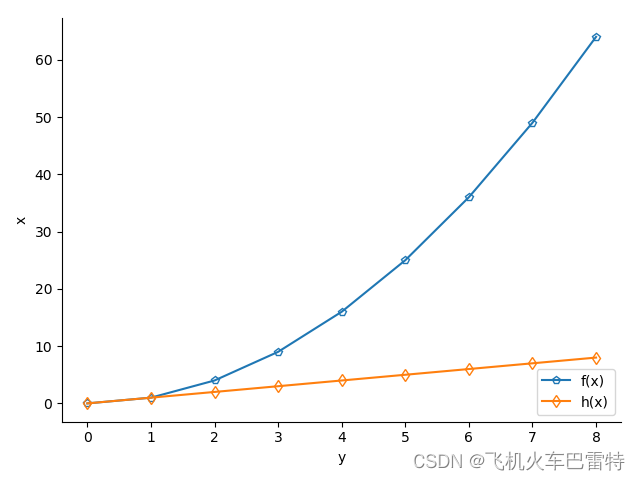
思路:使用spines['top'].set_visible(False)和spines['right'].set_visible(False)。
代码
import matplotlib.pyplot as plt

x = [0.0, 1.0, 2.0, 3.0, 4.0, 5.0, 6.0, 7.0, 8.0]
y1 = [0.0, 1.0, 4.0, 9.0, 16.0, 25.0, 36.0, 49.0, 64.0]
y2 = [0.0, 1.0, 2.0, 3.0, 4.0, 5.0, 6.0, 7.0, 8.0]
# 隐藏上边框和右边框
plt.gca().spines['top'].set_visible(False)
plt.gca().spines['right'].set_visible(False)
# 绘制
plt.plot(x, y1, label="f(x)", marker="p", mfc="none")
plt.plot(x, y2, label="h(x)", marker="d", mfc="none")
plt.legend(loc=4)
plt.xlabel("y")
plt.ylabel("x")
plt.show()
效果
5. 移动图中的标注位置
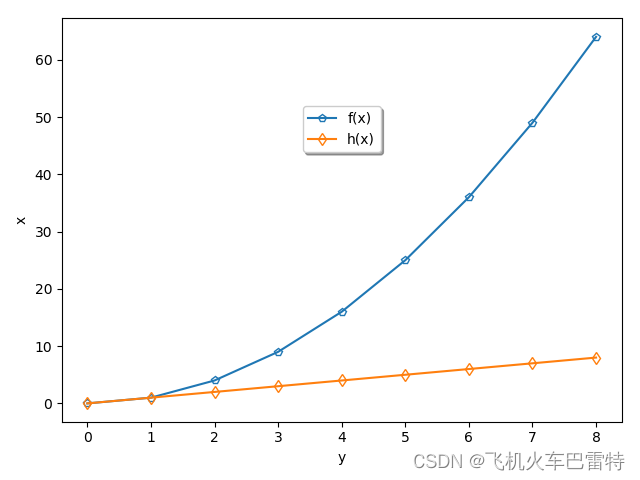
思路:使用legend()函数,并传入一些参数,其中是位置的移动,是标注的栏数。
代码
import matplotlib.pyplot as plt

x = [0.0, 1.0, 2.0, 3.0, 4.0, 5.0, 6.0, 7.0, 8.0]
y1 = [0.0, 1.0, 4.0, 9.0, 16.0, 25.0, 36.0, 49.0, 64.0]
y2 = [0.0, 1.0, 2.0, 3.0, 4.0, 5.0, 6.0, 7.0, 8.0]
# 绘制
plt.plot(x, y1, label="f(x)", marker="p", mfc="none")
plt.plot(x, y2, label="h(x)", marker="d", mfc="none")
# 设置标注的位置、栏数等
plt.legend(loc='upper center', bbox_to_anchor=(0.50, 0.8), ncol=1, fancybox=True, shadow=True)
plt.xlabel("y")
plt.ylabel("x")
plt.show()
效果
6. matplotlib bar字符下标按顺序显示
代码
import matplotlib.pyplot as plt

# 数据
optimizer = ['SGD', 'Adam', 'RMSprop', 'Adagrad']
training_time = [1.86, 0.66, 0.41, 0.59]
# 顺序下标核心代码
x_ticks = [i for i in range(len(optimizer))]    # 创建一个顺序
plt.bar(x_ticks, training_time, width=0.2)      # 绘制柱状图
plt.xticks(x_ticks)                             # 使用这个顺序
plt.gca().set_xticklabels(optimizer)            # 利用顺序匹配下标
plt.xlabel('optimizer')
plt.ylabel('training time (h)')
plt.show()
效果(下标是对得上的)


 2058
2058


 被折叠的 条评论
为什么被折叠?
被折叠的 条评论
为什么被折叠?
 到【灌水乐园】发言


