


 本文介绍了如何使用D3.js库在HTML页面上创建SVG图形,包括设置坐标轴(X轴和Y轴),并在坐标轴上生成网格线,以便数据可视化。
第一步 先按照上一节内容绘制坐标轴,注意 axisBottom 当作X轴,axisLeft 当作Y轴
let height = 500, width = 500, margin = 25;

const drawSvg = () => {
                        return d3.select('#d3Container').append('svg')
                            .attr('width', width)
                            .attr('height', height)
                            .attr('class', 'svg-box')
                    }

const drawAxisX = (svgContainer) => {
    let xLen = width - 2 * margin
    let xScale = d3.scaleLinear().domain([0, 50]).range([0, xLen])
    let axisX = d3.axisBottom().scale(xScale)
    svgContainer.append('g')
            .attr('transform', () =>
                'translate(' + margin + ',' + (width - margin) + ')')
            .call(axisX)

}

const drawAxisY = (svgContainer) => {
    let yLen = height - 2 * margin
    let yScale = d3.scaleLinear().domain([50, 0]).range([0, yLen])
    let axisY = d3.axisLeft().scale(yScale)
    svgContainer.append('g')
            .attr('transform', () =>
                'translate(' + margin + ',' + margin + ')')
            .call(axisY)

}


 const svgContainer = drawSvg()
 drawAxisX(svgContainer)
 drawAxisY(svgContainer)

第二步 在绘制好的坐标轴上,选取X轴上所有的tick,选取Y轴上所有的tick,以tick为原点绘制直线形成网格。
<script setup>
import { onMounted } from "vue";
import * as d3 from "d3";

let height = 500, width = 500, margin = 25;

const drawSvg = () => {
                        return d3.select('#d3Container').append('svg')
                            .attr('width', width)
                            .attr('height', height)
                            .attr('class', 'svg-box')
                    }

const drawAxisX = (svgContainer) => {
    let xLen = width - 2 * margin
    let xScale = d3.scaleLinear().domain([0, 50]).range([0, xLen])
    let axisX = d3.axisBottom().scale(xScale)
    svgContainer.append('g')
            .attr('class', 'x-axis')
            .attr('transform', () =>
                'translate(' + margin + ',' + (width - margin) + ')')
            .call(axisX)

    d3.selectAll('g.x-axis g.tick')
        .append('line')
        .classed('grid-line', true)
        .attr('x1', 0)
        .attr('y1', 0)
        .attr('x2', 0)
        .attr('y2', -(height - 2 * margin))

}

const drawAxisY = (svgContainer) => {
    let yLen = height - 2 * margin
    let yScale = d3.scaleLinear().domain([50, 0]).range([0, yLen])
    let axisY = d3.axisLeft().scale(yScale)
    svgContainer.append('g')
            .attr('class', 'y-axis')
            .attr('transform', () =>
                'translate(' + margin + ',' + margin + ')')
            .call(axisY)

    d3.selectAll('g.y-axis g.tick')
        .append('line')
        .classed('grid-line', true)
        .attr('x1', 0)
        .attr('y1', 0)
        .attr('x2', yLen)
        .attr('y2', 0)

}


onMounted(() => {
    const svgContainer = drawSvg()
    drawAxisX(svgContainer)
    drawAxisY(svgContainer)

})

</script>

<template>
    <div id="d3Container" class="container">
    </div>
</template>

<style lang="scss">
.container {
    width: 600px;
    height: 600px;
    margin:auto;
    background-color: #fbe9d5;

    .svg-box {
        margin: auto;
        background-color: #e97603;
    }

    .grid-line {
        stroke: #efe4fa;
    }
}
</style>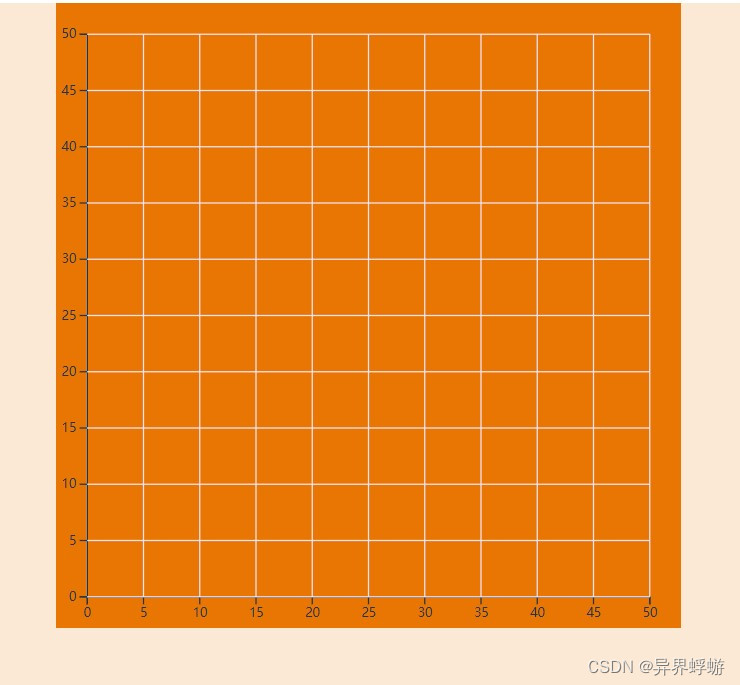
今晚太累了,明天分析网格的绘制过程,明晚不见不散!


 1万+
1万+

 被折叠的 条评论
为什么被折叠?
被折叠的 条评论
为什么被折叠?
 到【灌水乐园】发言


