


直接上代码,代码里需要用到聚宽平台的jqdata,可在聚宽研究环境中运行。
import numpy as np
import datetime
import jqdata
from jqdata import *
import pandas as pd
import matplotlib.pyplot as plt
import json #字符转换
matplotlib.rcParams['axes.unicode_minus']=False #图像中负号显示不正常
import matplotlib.ticker as mtk
###########可设定参数#############
# 设定复盘日期,-1为今天,-2为昨天,最多可看至十天前
trade_day = -1
##################################
#获取日期相关信息
def get_date(date,daynumb):
startday = list(jqdata.get_trade_days(end_date=date,count=daynumb))[0]
now1 = date.strftime("%Y-%m-%d %H:%M")
now2 = datetime.datetime.strptime(now1, "%Y-%m-%d %H:%M")
ne = now2 + datetime.timedelta(hours = 15)
now3 = startday.strftime("%Y-%m-%d %H:%M")
now4 = datetime.datetime.strptime(now3, "%Y-%m-%d %H:%M")
ns = now4 + datetime.timedelta(hours = 9)
npr = list(jqdata.get_trade_days(end_date=date,count=daynumb+1))[0]
return npr,ns,ne
#获取各指数日内日开盘价、收盘价、涨幅、振幅
def indexinfo(index,npr,ns,ne):
Data_min = get_price(index,frequency='1m',start_date= ns, end_date= ne,
fields=['open', 'close', 'high', 'low', 'volume'],fq='pre')
Data_day = get_price(index,frequency='1d',end_date= today,
fields=['open', 'close', 'high', 'low', 'volume','pre_close'],fq='pre',count = 1)
open_price = Data_min['open'][0]
close_price = Data_min['close'][-1]
rise = (Data_day['close'][0]/Data_day['pre_close'][0]-1)*100
amplitude = ((Data_day['high'][0]-Data_day['low'][0])/Data_day['close'][0])*100
return open_price,close_price,rise,amplitude
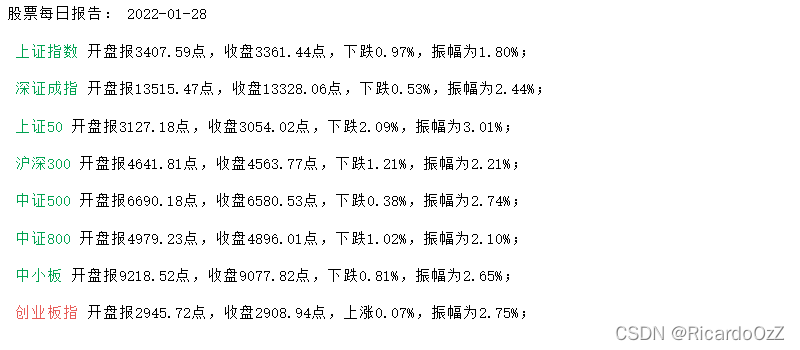
# 指数文字报告
def index_report(today, indexlist, labels):
print ("股票每日报告:",today,'\n')
for i in range(len(indexlist)):
open_price,close_price,rise,amplitude =indexinfo(indexlist[i],npr,ns1,ne1)
if rise > 0:
print("\033[0;31m %s \033[0m"%labels[i],end='')
print("开盘报%s点,收盘%s点,上涨%.2f%%,振幅为%.2f%%;\n"%(open_price,close_price,rise,amplitude))
else:
print("\033[0;32m %s \033[0m"%labels[i],end='')
print("开盘报%s点,收盘%s点,下跌%.2f%%,振幅为%.2f%%;\n"%(open_price,close_price,-rise,amplitude))
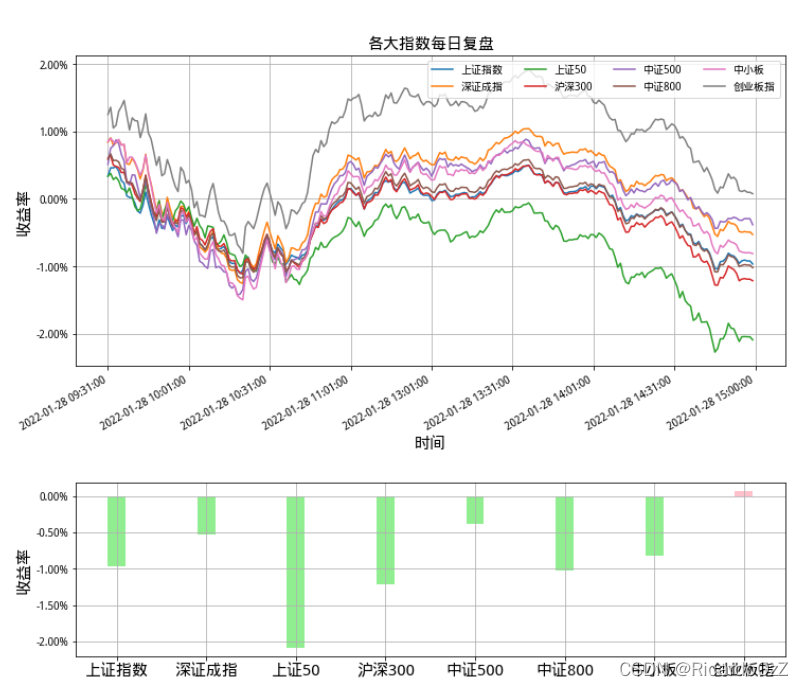
# 指数画图
def index_drawing(indexlist):
fig1, ax4 = plt.subplots(figsize=(12,6))
fig2, ax5 = plt.subplots(figsize=(12,3))
scale_ls = np.array(range(len(indexlist)))+1
def format_date(x, pos=None):
idx = np.clip(int(x+0.5), 0, Data.shape[0]-1)
return Data['time'].iat[idx]
for i in range(len(indexlist)):
code0 = indexlist[i]
Datap = get_price(code0,frequency='1d',end_date=npr,
fields=['close'],skip_paused=False,fq='pre',count = 1)
Data = get_price(code0,frequency='1m',start_date= ns1, end_date=ne1,
fields=['open', 'close', 'high', 'low', 'volume'],fq='pre')
Data['time'] = list(Data.index)
xax = np.arange(Data.shape[0])
val = ((Data['close']-Datap['close'][0])/Datap['close'][0])*100
ax4.plot(xax, val, label= labels[i])
if val[-1]<0:
ax5.bar(i+1,val[-1],width =0.2,color = 'lightgreen')
elif val[-1]>0:
ax5.bar(i+1,val[-1],width =0.2,color = 'pink')
xmajorLocator = mtk.MultipleLocator(30)
ax4.xaxis.set_major_locator(xmajorLocator)
ax4.xaxis.set_major_formatter(mtk.FuncFormatter(format_date))
fmt='%.2f%%'
yticks = mtk.FormatStrFormatter(fmt)
ax4.yaxis.set_major_formatter(yticks)
ax4.grid(True)
fig1.autofmt_xdate()
ax4.legend(loc='upper right',ncol=4)
ax4.set_xlabel('时间',fontsize=15)
ax4.set_ylabel('收益率',fontsize=15)
ax4.set_title('各大指数每日复盘',fontsize=15);
ax5.grid(True)
plt.xticks(scale_ls,labels,fontsize=15)
ax5.set_ylabel('收益率',fontsize=15)
ax5.yaxis.set_major_formatter(yticks)
plt.show()
today = list(jqdata.get_trade_days(end_date=datetime.datetime.now().date(),count=10))[trade_day]
# 交易开盘、收盘等时间相关日期
npr,ns1,ne1 = get_date(today,1)
yesterday = list(jqdata.get_trade_days(end_date=datetime.datetime.now().date(),count=3))[0]
npr2,ns2,ne2 = get_date(yesterday,1)
#常用指数及代码
indexlist= ['000001.XSHG','399001.XSHE','000016.XSHG','000300.XSHG','000905.XSHG','000906.XSHG','399005.XSHE','399006.XSHE']
labels = ['上证指数','深证成指','上证50', '沪深300', '中证500', '中证800','中小板','创业板指']
index_report(today, indexlist, labels)
index_drawing(indexlist)
运行结果如下:
(下面这段代码是刚入门的时候写的。。。太烂啦 有兴趣自己优化一下。。。)
#统计全A股信息
allstock = get_all_securities(types=['stock'])
finalrep = []
rise = 0
fall = 0
risestop = []
fallstop = []
risestopprice = []
fallstopprice = []
risestopamp = []
fallstopamp = []
risestoptype = []
fallstoptype = []
a0 = 0
a1 = 0
a2 = 0
a3 = 0
a4 = 0
a5 = 0
a6 = 0
a7 = 0
a8 = 0
a9 = 0
fa0 = 0
fa1 = 0
fa2 = 0
fa3 = 0
fa4 = 0
fa5 = 0
fa6 = 0
fa7 = 0
fa8 = 0
fa9 = 0
for i in range(len(allstock)):
code = allstock.index[i]
Datap = get_price(code,frequency='1d',end_date=npr,
fields=['close'],skip_paused=False,fq='pre',count = 1)
Data = get_price(code,frequency='1m',start_date= ns1, end_date= ne1,
fields=['open', 'close', 'high', 'low', 'volume','high_limit','low_limit'],fq='pre')
rep = (Data['close']-Datap['close'][0])/Datap['close'][0]
if rep[-1] > 0:
rise+=1
if rep[-1] < 0:
fall+=1
if 0<rep[-1]<=0.01:
a0+=1
if 0.01<rep[-1]<=0.02:
a1+=1
if 0.02<rep[-1]<=0.03:
a2+=1
if 0.03<rep[-1]<=0.04:
a3+=1
if 0.04<rep[-1]<=0.05:
a4+=1
if 0.05<rep[-1]<=0.06:
a5+=1
if 0.06<rep[-1]<=0.07:
a6+=1
if 0.07<rep[-1]<=0.08:
a7+=1
if 0.08<rep[-1]<=0.09:
a8+=1
if 0.09<rep[-1]:
a9+=1
if -0.01<=rep[-1]<0:
fa0+=1
if -0.02<=rep[-1]<-0.01:
fa1+=1
if -0.03<=rep[-1]<-0.02:
fa2+=1
if -0.04<=rep[-1]<-0.03:
fa3+=1
if -0.05<=rep[-1]<-0.04:
fa4+=1
if -0.06<=rep[-1]<-0.05:
fa5+=1
if -0.07<=rep[-1]<-0.06:
fa6+=1
if -0.08<=rep[-1]<-0.07:
fa7+=1
if -0.09<=rep[-1]<-0.08:
fa8+=1
if rep[-1]<-0.09:
fa9+=1
if round(Data['close'][-1],2) == round(Datap['close'][0]*1.1,2):
risestop.append(code)
risestopprice.append(Data['close'][-1])
x = round(Data['close'][-1]/Datap['close'][0],4)-1
baix = '%.2f%%' % (x * 100)
risestopamp.append(baix)
count = 0
for element in Data['close']:
if element == Data['close'][-1]:
count+=1
if count == len(Data['close']):
risestoptype.append(1)
else:
risestoptype.append(0)
if round(Data['close'][-1],2) == round(Datap['close'][0]*0.9,2):
fallstop.append(code)
fallstopprice.append(Data['close'][-1])
x = round(Data['close'][-1]/Datap['close'][0],4)-1
baix = '%.2f%%' % (x * 100)
fallstopamp.append(baix)
count = 0
for element in Data['close']:
if element == Data['close'][-1]:
count+=1
if count == len(Data['close']):
fallstoptype.append(1)
else:
fallstoptype.append(0)
if get_extras('is_st', code, start_date=ns1, end_date=ne1).values:
if round(Data['close'][-1],2) == round(Datap['close'][0]*1.05,2):
risestop.append(code)
risestopprice.append(Data['close'][-1])
x = round(Data['close'][-1]/Datap['close'][0],4)-1
baix = '%.2f%%' % (x * 100)
risestopamp.append(baix)
count = 0
for element in Data['close']:
if element == Data['close'][-1]:
count+=1
if count == len(Data['close']):
risestoptype.append(1)
else:
risestoptype.append(0)
if round(Data['close'][-1],2) == round(Datap['close'][0]*0.95,2):
fallstop.append(code)
fallstopprice.append(Data['close'][-1])
x = round(Data['close'][-1]/Datap['close'][0],4)-1
baix = '%.2f%%' % (x * 100)
fallstopamp.append(baix)
count = 0
for element in Data['close']:
if element == Data['close'][-1]:
count+=1
if count == len(Data['close']):
fallstoptype.append(1)
else:
fallstoptype.append(0)
finalrep.append(float('%.3f' % rep[-1]))
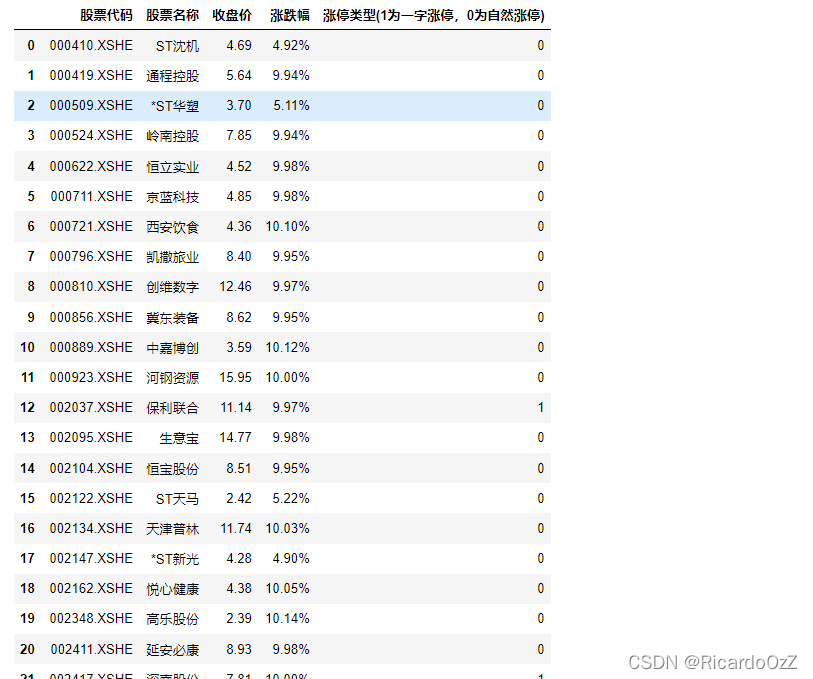
risestopinfo = pd.DataFrame(columns=('股票代码', '股票名称', '收盘价','涨跌幅','涨停类型(1为一字涨停,0为自然涨停)'))
risestopinfo['股票代码'] = risestop
risestopinfo['股票名称'] = allstock.display_name[risestop].values
risestopinfo['收盘价'] = risestopprice
risestopinfo['涨跌幅'] = risestopamp
risestopinfo['涨停类型(1为一字涨停,0为自然涨停)'] = risestoptype
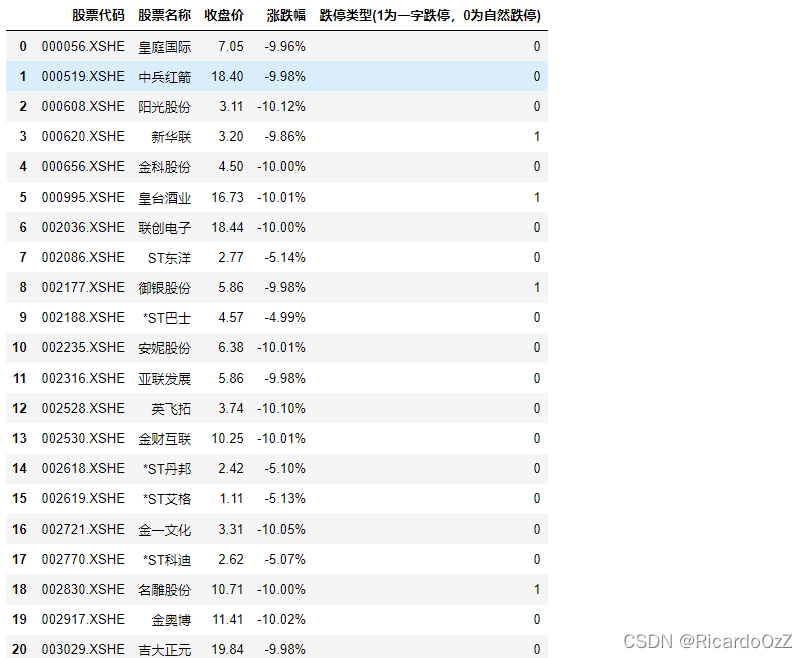
fallstopinfo = pd.DataFrame(columns=('股票代码', '股票名称', '收盘价','涨跌幅','跌停类型(1为一字跌停,0为自然跌停)'))
fallstopinfo['股票代码'] = fallstop
fallstopinfo['股票名称'] = allstock.display_name[fallstop].values
fallstopinfo['收盘价'] = fallstopprice
fallstopinfo['涨跌幅'] = fallstopamp
fallstopinfo['跌停类型(1为一字跌停,0为自然跌停)'] = fallstoptype
#统计一字跌停、自然跌停个数
zi = 0
yi = 0
for element in risestopinfo['涨停类型(1为一字涨停,0为自然涨停)']:
if element == 0 :
zi +=1
if element == 1:
yi += 1
zi1 = 0
yi1 = 0
for element in fallstopinfo['跌停类型(1为一字跌停,0为自然跌停)']:
if element == 0 :
zi1 +=1
if element == 1:
yi1 += 1
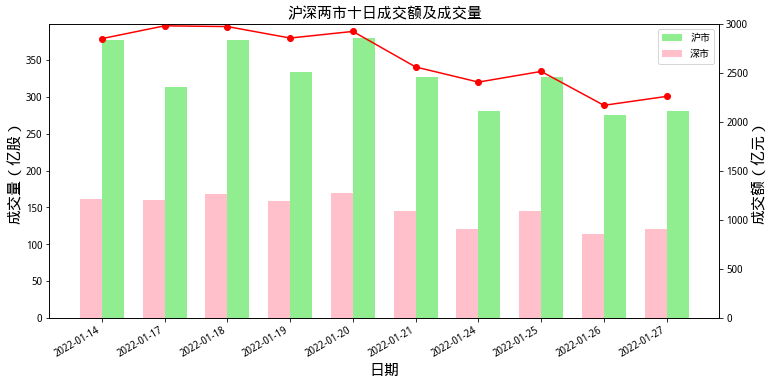
#沪深两市十日成交额及成交量
tenday = list(jqdata.get_trade_days(end_date=datetime.datetime.now().date(),count=11))
data = get_price('000001.XSHG', start_date=tenday[0], end_date=tenday[-2], frequency='daily', fields=['volume','money'])
data2 = get_price('399001.XSHE', start_date=tenday[0], end_date=tenday[-2], frequency='daily', fields=['volume','money'])
dvolume = data['volume']
dmoney = data['money']
dvolume2 = data2['volume']
dmoney2 = data2['money']
bar_width = 0.35
xax = np.arange(data.shape[0])
fig = plt.figure(figsize=(12,6))
ax1 = fig.add_subplot(111)
ax1.bar(xax+(bar_width)/2, dvolume/100000000,bar_width,color = 'lightgreen',label="沪市")
ax1.bar(xax-(bar_width)/2, dvolume2/100000000,bar_width,color = 'pink',label="深市")
ax1.set_ylabel("成交量(亿股)",fontsize=15)
ax1.set_title("沪深两市十日成交额及成交量",fontsize=15)
ax1.set_xlabel("日期",fontsize=15)
ax1.legend(loc='upper right')
ax2 = ax1.twinx()
ax2.plot(xax, dmoney/100000000,color='green',marker='o')
ax2.plot(xax, dmoney2/100000000,color='red',marker='o')
ax2.set_ylim([0, 3000])
ax2.set_ylabel("成交额(亿元)",fontsize=15)
fig.autofmt_xdate()
plt.xticks(xax,data.index.strftime("%Y-%m-%d"),fontsize=15)
plt.show()
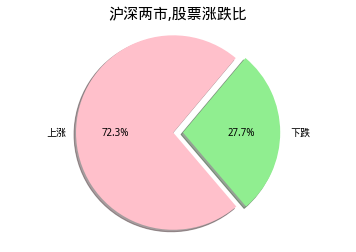
#沪深两市中,涨跌股票
drawlist=[]
drawlistlabels = ['上涨','下跌']
colorlabel = ['pink','lightgreen']
drawlist.append(rise)
drawlist.append(fall)
plt.pie(drawlist,autopct='%1.1f%%',labels=drawlistlabels,colors= colorlabel,startangle=50,explode=[0.05,0.05],shadow = True)
plt.axis('equal')
plt.title('沪深两市,股票涨跌比',fontsize=15)
plt.show()
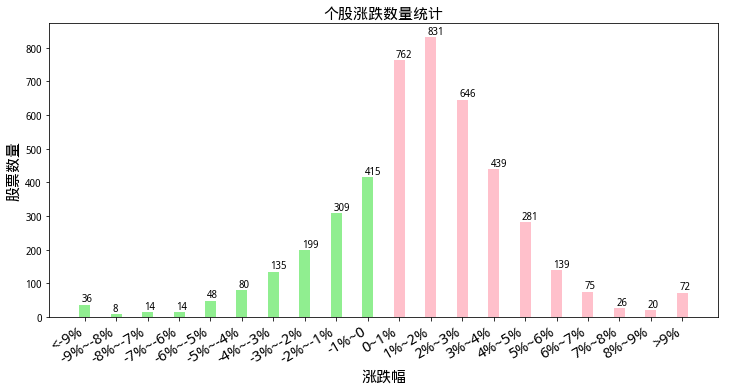
#个股涨跌数量统计
liststock = [fa9,fa8,fa7,fa6,fa5,fa4,fa3,fa2,fa1,fa0,a0,a1,a2,a3,a4,a5,a6,a7,a8,a9]
liststockx = []
zdf = ['<-9%','-9%~-8%','-8%~-7%','-7%~-6%','-6%~-5%','-5%~-4%','-4%~-3%','-3%~-2%','-2%~-1%','-1%~0',
'0~1%','1%~2%','2%~3%','3%~4%','4%~5%','5%~6%','6%~7%','7%~8%','8%~9%','>9%']
for i in range(len(liststock)):
liststockx.append(i)
fig, ax2 = plt.subplots(figsize=(12,6))
for i in range(0,10):
ax2.bar(liststockx[i], liststock[i],bar_width,color = 'lightgreen')
ax2.text(liststockx[i]-0.1, liststock[i]+10, liststock[i])
for i in range(10,20):
ax2.bar(liststockx[i], liststock[i],bar_width,color = 'pink')
ax2.text(liststockx[i]-0.1, liststock[i]+10, liststock[i])
fig.autofmt_xdate()
ax2.set_ylabel("股票数量",fontsize=15)
ax2.set_title("个股涨跌数量统计",fontsize=15)
ax2.set_xlabel("涨跌幅",fontsize=15)
plt.xticks(liststockx,zdf,fontsize=15)
plt.show()
运行结果如下:
from collections import Counter

# 展示股票池行业分布
def get_stock_industry_distribution(stock_pool, rise=True):
    hy_name_list = []
    for i in range(len(stock_pool)):
        try:
            hy_name = get_industry(stock_pool[i])[stock_pool[i]]['jq_l1']['industry_name']
            hy_name_list.append(hy_name)
        except:
            pass
    print(hy_name_list)
    result=Counter(hy_name_list)
    result = np.array(sorted(result.items(), key=lambda d:d[0]))

    fig = plt.figure(figsize=(12,6))
    plt.pie(result[:,1],autopct='%1.1f%%',labels=result[:,0])
    plt.axis('equal')
    plt.show()

print ("沪深两市中,股票涨停%d只,跌停%d只。"%(len(risestop),len(fallstop)))
print ("涨停股票中,一字涨停%d只,自然涨停%d只。\n跌停股票中,一字跌停%d只,自然跌停%d只。"%(yi,zi,yi1,zi1))

print('\n')
print('\033[0;31m涨停股票\033[0m',end='')
print('行业分布:')
get_stock_industry_distribution(risestopinfo['股票代码'])
print('\033[0;32m跌停股票\033[0m',end='')
print('行业分布:')
get_stock_industry_distribution(fallstopinfo['股票代码'])
运行结果如下:


print ("涨停股票")
risestopinfo
print("跌停股票")
fallstopinfo


 1157
1157

 被折叠的 条评论
为什么被折叠?
被折叠的 条评论
为什么被折叠?
 到【灌水乐园】发言


