


示例
代码如下
test_fpr, test_tpr, test_thresholds = roc_curve(y_test_two, dataset_blend_test_pred, pos_label=1)
test_roc_auc = auc(test_fpr, test_tpr)
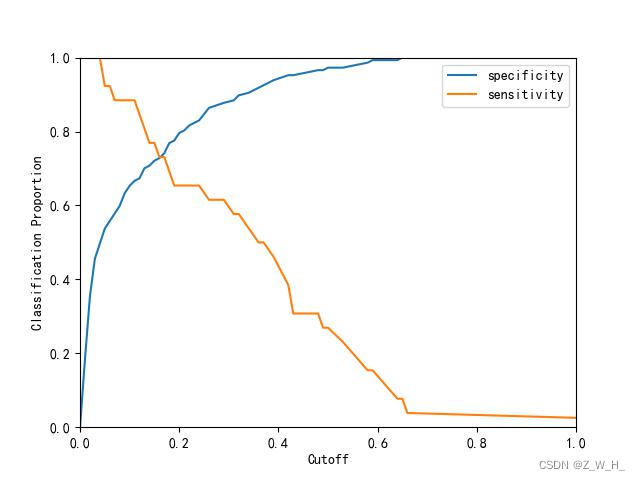
plt.plot(test_thresholds, 1-test_fpr, label='specificity')
plt.plot(test_thresholds, test_tpr, label='sensitivity')
plt.xlim([0, 1])
plt.ylim([0, 1])
plt.ylabel('Classification Proportion')
plt.xlabel('Cutoff')
plt.legend()
plt.savefig(temp_path + '敏感性特异性曲线.jpg')
plt.show()
plt.close()


 4727
4727

 被折叠的 条评论
为什么被折叠?
被折叠的 条评论
为什么被折叠?
 到【灌水乐园】发言


