


附带详细的理论+代码详解视频,见某站lvqaq的数学建模
import numpy as np
import matplotlib.pyplot as plt
import random
import copy
import random
def createInd(J):
'''
初始化操作,一次初始化一个个体,机器矩阵从1开始
J: 机器顺序矩阵,J[i, j]表示加工i工件的第j个操作的机器号。大小为n*m
T: 加工时间矩阵,T[i, j]表示工件j再机器i上的加工时间。大小为m*n
'''
n = J.shape[0] # 工件数
# m = J.shape[1] # 机器数
s = []
Ji = J.copy()
while not np.all(Ji == 0):
I = np.random.randint(0, n)
M = Ji[I, 0]
if M != 0:
s.append(I)
b = np.roll(Ji[I, :], -1)
b[-1] = 0
Ji[I, :] = b
return s
def decode(J, P, s):
"""
function:
JSP解码函数,用于计算C_max和生成甘特图。
parameter:
- J: 机器顺序矩阵,J[i, j]表示加工i工件的第j个操作的机器号。
- P: 加工时间矩阵,P[i, j]表示工件i在机器j上的加工时间。
- s: 待解码的序列。
return:
- T: 甘特图矩阵。
- M: 工件排列矩阵。
- C: 完工时间矩阵。
"""
n, m = J.shape
T = [[[0]] for _ in range(m)]
C = np.zeros((n, m))
k = np.zeros(n, dtype=int)
for job in s:
machine = J[job, k[job]] - 1
process_time = P[job, k[job]]
last_job_finish = C[job, k[job] - 1] if k[job] > 0 else 0
# 寻找机器上的第一个合适空闲时间段
start_time = max(last_job_finish, T[machine][-1][-1]) # 默认在最后一个任务后开始
insert_index = len(T[machine]) # 默认插入位置在末尾
for i in range(1, len(T[machine])):
gap_start = max(T[machine][i - 1][-1], last_job_finish)
gap_end = T[machine][i][0]
if gap_end - gap_start >= process_time:
start_time = gap_start # 找到合适的起始时间
insert_index = i # 更新插入位置
break
end_time = start_time + process_time
C[job, k[job]] = end_time
T[machine].insert(insert_index, [start_time, job, k[job], end_time])
k[job] += 1
# 根据T矩阵构建M矩阵
M = [[] for _ in range(m)]
for machine in range(m):
for entry in T[machine][1:]:
M[machine].append(entry[1]) # 工件号
return T, M, C
def drawGantt(timeList):
T = timeList.copy()
# 创建一个新的图形
plt.rcParams['font.sans-serif'] = ['SimHei']
fig, ax = plt.subplots(figsize=(10, 6))
# 颜色映射字典,为每个工件分配一个唯一的颜色
color_map = {}
for machine_schedule in T:
for task_data in machine_schedule[1:]:
job_idx, operation_idx = task_data[1], task_data[2]
if job_idx not in color_map:
# 为新工件分配一个随机颜色
color_map[job_idx] = (random.random(), random.random(), random.random())
# 遍历机器
for machine_idx, machine_schedule in enumerate(T):
for task_data in machine_schedule[1:]:
start_time, job_idx, operation_idx, end_time = task_data
color = color_map[job_idx] # 获取工件的颜色
# 绘制甘特图条形,使用工件的颜色
ax.barh(machine_idx, end_time - start_time, left=start_time, height=0.4, color=color)
# 在色块内部标注工件-工序
label = f'{job_idx}-{operation_idx}'
ax.text((start_time + end_time) / 2, machine_idx, label, ha='center', va='center', color='white',
fontsize=10)
# 设置Y轴标签为机器名称
ax.set_yticks(range(len(T)))
ax.set_yticklabels([f'Machine {i+1}' for i in range(len(T))])
# 设置X轴标签
plt.xlabel("时间")
# 添加标题
plt.title("JSP问题甘特图")
# 创建图例,显示工件颜色
legend_handles = []
for job_idx, color in color_map.items():
legend_handles.append(plt.Rectangle((0, 0), 1, 1, color=color, label=f'Job {job_idx}'))
plt.legend(handles=legend_handles, title='工件')
# # 显示图形
# plt.show()
def createPop(Jm, popSize):
pop = []
for i in range(popSize):
pop.append(createInd(Jm))
return pop
def cross(A, B):
'''
A, B是两个相同长度的list,该函数用于交叉两个list,然后返回两个新的list
'''
n = len(A)
r1 = np.random.randint(n)
r2 = np.random.randint(n)
# r1, r2 = 3, 1
rl, rr = min(r1, r2), max(r1, r2)
if rl == rr:
return A, B
# for A
bt = copy.deepcopy(B)
afinal = copy.deepcopy(A)
for i in range(rl, rr+1):
bt.remove(A[i])
k = 0
for i in range(n):
if i < rl or i > rr:
afinal[i] = bt[k]
k += 1
# for B
# print(A, B)
at = copy.deepcopy(A)
bfinal = copy.deepcopy(B)
for i in range(rl, rr+1):
at.remove(B[i])
k = 0
for i in range(n):
if i < rl or i > rr:
bfinal[i] = at[k]
k += 1
return afinal, bfinal
def load_data(path):
# 从文本文件读取数据
with open(path, 'r') as file:
lines = file.readlines()
# 解析工件数和机器数
workpiece, machines = map(int, lines[0].split())
# 初始化 J 和 P 数组
J = np.zeros((workpiece, len(lines[1].split()) // 2), dtype=int)
P = np.zeros((workpiece, len(lines[1].split()) // 2), dtype=int)
# 解析机器编号和加工时间
for i in range(1, len(lines)):
data = list(map(int, lines[i].split()))
# print(data)
for j in range(len(data)):
if j % 2 == 0:
J[i - 1][j // 2] = data[j]+1
else:
P[i - 1][j // 2] = data[j]
return J, P
if __name__ == '__main__':
# demo1
# J = np.array([[2,0,1,3,5,4],[1,2,4,5,0,3],[2,3,5,0,1,4],[1,0,2,3,4,5],[2,1,4,5,0,3],[1,3,5,0,4,2]])+1
# P = np.array([[1,3,6,7,3,6],[8,5,10,10,10,4],[5,4,8,9,1,7],[5,5,5,3,8,9],[9,3,5,4,3,1],[3,3,9,10,4,1]])
# demo2
# J = np.array([[2, 1], [1, 2], [1, 2]])
# P = np.array([[1, 2], [3, 2], [1, 1]])
# demo3
J = np.array([[1, 2, 3], [2, 1, 3], [3, 1, 2]])
P = np.array([[2, 1, 3], [3, 3, 2], [2, 2, 2]])
# J, P = load_data('FT06.txt')
n = J.shape[0] # 工件数
m = J.shape[1] # 机器数
pop_size = 40
gen = n*m
pop = createPop(J, pop_size)
Tmax, _, C = decode(J, P, pop[0])
fitness = [C.max()]
Cmax = C.max()
bestID = 0
bestInd = copy.deepcopy(pop[0])
for i in range(1, pop_size):
T_, _, C_ = decode(J, P, pop[i])
if C_.max() < Cmax:
Tmax = T_
Cmax = C_.max()
bestInd = copy.deepcopy(pop[i])
fitness.append(C_.max())
g = 0
chistory = []
while g < gen:
g += 1
# 所有个体的交叉操作
l = 0
newInd = []
newFitness = []
while l < pop_size/2:
tm = np.random.randint(pop_size) # 随机一个与最优个体交叉
I1, I2 = cross(pop[tm], bestInd)
T1, _, C1 = decode(J, P, I1) # 对交叉后的解码
newInd.append(I1) # 交叉后的个体添加入newInd
newFitness.append(C1.max()) # 交叉后的适应度添加入newFitness
if C1.max() < Cmax: # 如果适应度比已知最优个体还好
Cmax = C1.max() # 更新最佳适应度
Tmax = T1 # 更新最优调度
bestInd = copy.deepcopy(I1) # 更新最优个体
T2, _, C2 = decode(J, P, I2)
newInd.append(I2)
newFitness.append(C2.max())
if C2.max() < Cmax:
Cmax = C2.max()
Tmax = T2
bestInd = copy.deepcopy(I2)
l += 1
newpop = pop + newInd # 交叉后的种群与原来种群合并
newFit = fitness + newFitness # 适应度也合并
newId = np.array(newFit).argsort()[:pop_size] # 取最好的40个的ID
pop = copy.deepcopy([newpop[i] for i in newId])
fitness = [newFit[i] for i in newId]
# 变异操作
for i in range(pop_size):
index1, index2 = random.sample(range(n*m), 2)
pop[i][index1], pop[i][index2] = pop[i][index2], pop[i][index1]
Ind = copy.deepcopy(pop[i])
Tt, _, Ct = decode(J, P, Ind)
fitness[i] = Ct.max()
if Ct.max() < Cmax:
Cmax = Ct.max()
Tmax = Tt
bestInd = Ind
print('第{}代,Cmax={}'.format(g, Cmax))
wait_time = 0
for i in Tmax:
for j in range(1, len(i)):
wait_time += i[j][0] - i[j-1][-1]
print('第{}代,平均机器等待时间={}'.format(g, (Cmax*m - J.sum())/m))
chistory.append(Cmax)
index = chistory.index(Cmax)
print(f"{Cmax}首次出现的索引是:{index}")
print(Tmax)
print(decode(J, P, bestInd)[1])
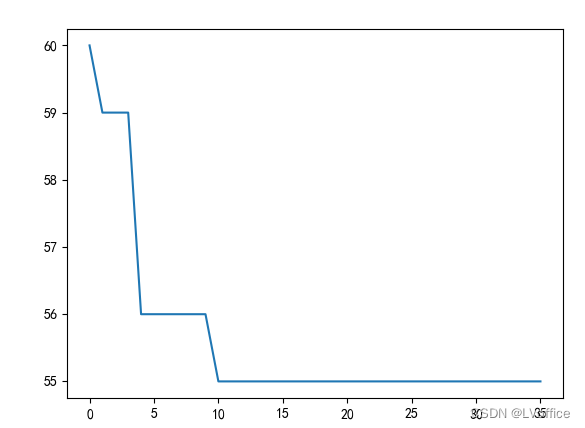
plt.plot(chistory)
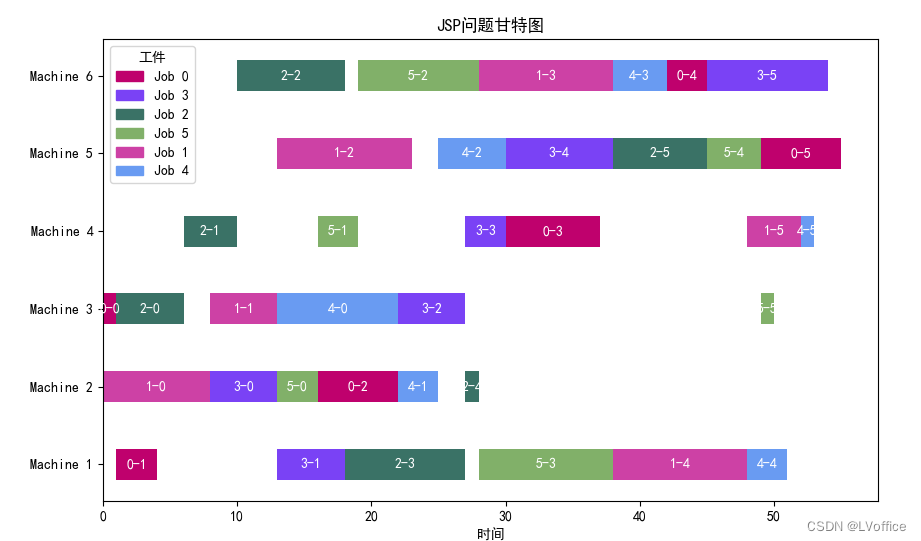
drawGantt(Tmax)
plt.show()
遗传算法收敛曲线:
FT06数据集甘特图:


 608
608

 被折叠的 条评论
为什么被折叠?
被折叠的 条评论
为什么被折叠?
 到【灌水乐园】发言


