


机器学习之信用卡欺诈检测
一、机器学习之信用卡欺诈检测
1.1 前言
- 数据来源:Kaggle 信用卡欺诈检测数据集https://www.kaggle.com/datasets/mlg-ulb/creditcardfraud?resource=download;
- 本文采用 XGBoost、随机森林、KNN、逻辑回归、SVM 和决策树解决信用卡欺诈检测问题;
1.2 案例分析
1.2.1 导入所需模块到 python 环境
# 1、导入所需模块到 python 环境中
import pandas as pd
import numpy as np
import matplotlib.pyplot as plt
from termcolor import colored as cl
import itertools
from sklearn.preprocessing import StandardScaler
from sklearn.model_selection import train_test_split
from sklearn.tree import DecisionTreeClassifier
from sklearn.neighbors import KNeighborsClassifier
from sklearn.linear_model import LogisticRegression
from sklearn.svm import SVC
from sklearn.ensemble import RandomForestClassifier
from xgboost import XGBClassifier
from sklearn.metrics import confusion_matrix, accuracy_score, f1_score
1.2.2 读取数据,删除无用的Time列
- 关于数据: 我们将要使用的数据是 Kaggle 信用卡欺诈检测数据集。它包含特征 V1 到 V28,是 PCA 获得的主要成分,并忽略对构建模型没有用的时间特征。
- 其余的特征是包含交易总金额的"金额"特征和包含交易是否为欺诈案件的"类别"特征,类别0标识欺诈,类别1表示正常。
df = pd.read_csv(r'../creditcard.csv')
print("Data's columns contain:\n", df.columns)
print("Data shape:\n", df.shape)
df.drop('Time', axis=1, inplace=True)
pd.set_option('display.max_columns', df.shape[1])
print(df.head())
'''
Data's columns contain:
 Index(['Time', 'V1', 'V2', 'V3', 'V4', 'V5', 'V6', 'V7', 'V8', 'V9', 'V10',
       'V11', 'V12', 'V13', 'V14', 'V15', 'V16', 'V17', 'V18', 'V19', 'V20',
       'V21', 'V22', 'V23', 'V24', 'V25', 'V26', 'V27', 'V28', 'Amount',
       'Class'],
      dtype='object')
Data shape:
 (284807, 31)
         V1        V2        V3        V4        V5        V6        V7  \
0 -1.359807 -0.072781  2.536347  1.378155 -0.338321  0.462388  0.239599
1  1.191857  0.266151  0.166480  0.448154  0.060018 -0.082361 -0.078803
2 -1.358354 -1.340163  1.773209  0.379780 -0.503198  1.800499  0.791461
3 -0.966272 -0.185226  1.792993 -0.863291 -0.010309  1.247203  0.237609
4 -1.158233  0.877737  1.548718  0.403034 -0.407193  0.095921  0.592941

         V8        V9       V10       V11       V12       V13       V14  \
0  0.098698  0.363787  0.090794 -0.551600 -0.617801 -0.991390 -0.311169
1  0.085102 -0.255425 -0.166974  1.612727  1.065235  0.489095 -0.143772
2  0.247676 -1.514654  0.207643  0.624501  0.066084  0.717293 -0.165946
3  0.377436 -1.387024 -0.054952 -0.226487  0.178228  0.507757 -0.287924
4 -0.270533  0.817739  0.753074 -0.822843  0.538196  1.345852 -1.119670

        V15       V16       V17       V18       V19       V20       V21  \
0  1.468177 -0.470401  0.207971  0.025791  0.403993  0.251412 -0.018307
1  0.635558  0.463917 -0.114805 -0.183361 -0.145783 -0.069083 -0.225775
2  2.345865 -2.890083  1.109969 -0.121359 -2.261857  0.524980  0.247998
3 -0.631418 -1.059647 -0.684093  1.965775 -1.232622 -0.208038 -0.108300
4  0.175121 -0.451449 -0.237033 -0.038195  0.803487  0.408542 -0.009431

        V22       V23       V24       V25       V26       V27       V28  \
0  0.277838 -0.110474  0.066928  0.128539 -0.189115  0.133558 -0.021053
1 -0.638672  0.101288 -0.339846  0.167170  0.125895 -0.008983  0.014724
2  0.771679  0.909412 -0.689281 -0.327642 -0.139097 -0.055353 -0.059752
3  0.005274 -0.190321 -1.175575  0.647376 -0.221929  0.062723  0.061458
4  0.798278 -0.137458  0.141267 -0.206010  0.502292  0.219422  0.215153

   Amount  Class
0  149.62      0
1    2.69      0
2  378.66      0
3  123.50      0
4   69.99      0
'''
1.2.3 探索性数据分析及数据预处理
cases = len(df)
nonfraud_cases = df[df.Class == 0]  # 非欺诈
fraud_cases = df[df.Class == 1]  # 欺诈
fraud_percentage = round(len(nonfraud_cases) / cases * 100, 2)
print(cl('CASE COUNT', attrs=['bold']))
print(cl('-' * 40, attrs=['bold']))
print(cl('Total number of cases are {}'.format(cases), attrs=['bold']))
print(cl('Number of Non-fraud cases are {}'.format(len(nonfraud_cases)), attrs=['bold']))
print(cl('Number of fraud cases are {}'.format(len(fraud_cases)), attrs=['bold']))
print(cl('Percentage of fraud cases is {}%'.format(fraud_percentage), attrs=['bold']))
print(cl('-' * 40, attrs=['bold']))
print(cl('CASE AMOUNT STATISTICS', attrs=['bold']))
print(cl('-' * 40, attrs=['bold']))
print(cl('NON-FRAUD CASE AMOUNT STATS', attrs=['bold']))
print(nonfraud_cases.Amount.describe())
print(cl('-' * 40, attrs=['bold']))
print(cl('FRAUD CASE AMOUNT STATS', attrs=['bold']))
print(fraud_cases.Amount.describe())
print(cl('-' * 40, attrs=['bold']))
# 通过查看,‘Amount’金额变化较大,需对其进行标准化
sc = StandardScaler()
amount = df.Amount.values
df.Amount = sc.fit_transform(amount.reshape(-1, 1))
print(cl(df.Amount.head(10), attrs=['bold']))
# 特征选择和数据集拆分
x = df.drop('Class', axis=1).values
y = df.Class.values
x_train, x_test, y_train, y_test = train_test_split(x, y, test_size=0.2, random_state=0)
'''
CASE COUNT
----------------------------------------
Total number of cases are 284807
Number of Non-fraud cases are 284315
Number of fraud cases are 492
Percentage of fraud cases is 99.83%
----------------------------------------
CASE AMOUNT STATISTICS
----------------------------------------
NON-FRAUD CASE AMOUNT STATS
count    284315.000000
mean         88.291022
std         250.105092
min           0.000000
25%           5.650000
50%          22.000000
75%          77.050000
max       25691.160000
Name: Amount, dtype: float64
----------------------------------------
FRAUD CASE AMOUNT STATS
count     492.000000
mean      122.211321
std       256.683288
min         0.000000
25%         1.000000
50%         9.250000
75%       105.890000
max      2125.870000
Name: Amount, dtype: float64
----------------------------------------
0    0.244964
1   -0.342475
2    1.160686
3    0.140534
4   -0.073403
5   -0.338556
6   -0.333279
7   -0.190107
8    0.019392
9   -0.338516
Name: Amount, dtype: float64'''
1.2.4 构建六类分类模型
- Decision Tree
tree_model = DecisionTreeClassifier(max_depth=4, criterion='entropy').fit(x_train, y_train)
tree_yhat = tree_model.predict(x_test)
- K-Nearest Neighbors
knn_model = KNeighborsClassifier(n_neighbors=5).fit(x_train, y_train)
knn_yhat = knn_model.predict(x_test)
- Logistic Regression
lr_model = LogisticRegression().fit(x_train, y_train)
lr_yhat = lr_model.predict(x_test)
- SVM
svm_model = SVC().fit(x_train, y_train)
svm_yhat = svm_model.predict(x_test)
- Random Forest Tree
rf_model = RandomForestClassifier(max_depth=4).fit(x_train, y_train)
rf_yhat = rf_model.predict(x_test)
- XGBoost
xgb_model = XGBClassifier(max_depth=4).fit(x_train, y_train)
xgb_yhat = xgb_model.predict(x_test)
1.2.5 用评估指标评估创建的分类模型
- 准确率
print(cl('-' * 40, attrs=['bold']))
print(cl('ACCURACY SCORE', attrs=['bold']))
print(cl('Accuracy score of the Decision Tree model is {}'.format(round(accuracy_score(y_test, tree_yhat), 4)),
         attrs=['bold']))
print(cl('Accuracy score of the knn model is {}'.format(round(accuracy_score(y_test, knn_yhat), 4)), attrs=['bold']))
print(cl('Accuracy score of the Logistic Regression model is {}'.format(round(accuracy_score(y_test, lr_yhat), 4)),
         attrs=['bold']))
print(cl('Accuracy score of the SVM model is {}'.format(round(accuracy_score(y_test, svm_yhat), 4)), attrs=['bold']))
print(cl('Accuracy score of the Random Forest model is {}'.format(round(accuracy_score(y_test, rf_yhat), 4)),
         attrs=['bold']))
print(
    cl('Accuracy score of the XGBoost model is {}'.format(round(accuracy_score(y_test, xgb_yhat), 4)), attrs=['bold']))
'''
ACCURACY SCORE
Accuracy score of the Decision Tree model is 0.9994
Accuracy score of the knn model is 0.9995
Accuracy score of the Logistic Regression model is 0.9992
Accuracy score of the SVM model is 0.9993
Accuracy score of the Random Forest model is 0.9993
Accuracy score of the XGBoost model is 0.9995
'''
- F1值
print(cl('-' * 40, attrs=['bold']))
print(cl('F1 SCORE', attrs=['bold']))
print(cl('F1 score of the Decision Tree model is {}'.format(round(f1_score(y_test, tree_yhat), 4)), attrs=['bold']))
print(cl('F1 score of the knn model is {}'.format(round(f1_score(y_test, knn_yhat), 4)), attrs=['bold']))
print(cl('F1 score of the Logistic Regression model is {}'.format(round(f1_score(y_test, lr_yhat), 4)), attrs=['bold']))
print(cl('F1 score of the SVM model is {}'.format(round(f1_score(y_test, svm_yhat), 4)), attrs=['bold']))
print(cl('F1 score of the Random Forest model is {}'.format(round(f1_score(y_test, rf_yhat), 4)), attrs=['bold']))
print(cl('F1 score of the XGBoost model is {}'.format(round(f1_score(y_test, xgb_yhat), 4)), attrs=['bold']))
'''
F1 SCORE
F1 score of the Decision Tree model is 0.8105
F1 score of the knn model is 0.8571
F1 score of the Logistic Regression model is 0.7356
F1 score of the SVM model is 0.7771
F1 score of the Random Forest model is 0.7657
F1 score of the XGBoost model is 0.8449
'''
- 混淆矩阵
def plot_confusion_matrix(cm, classes, title, cmap=plt.cm.Blues):
    title = 'Confusion Matrix of {}'.format(title)
    plt.imshow(cm, cmap=cmap)
    plt.title(title)
    plt.colorbar()
    marks = np.arange(len(classes))
    plt.xticks(marks, classes, rotation=45)
    plt.yticks(marks, classes)
    thresh = cm.max() / 2
    for i, j in itertools.product(range(cm.shape[0]), range(cm.shape[1])):  # 笛卡尔积
        plt.text(j, i, format(cm[i, j], 'd'), horizontalalignment='center',
                 color='white' if cm[i, j] > thresh else 'black')
        """
        设置文字说明
        plt.text(x,y,string,fontsize=15,verticalalignment="top",horizontalalignment="right")
        参数:
        x,y:表示坐标值上的值
        string:表示说明文字
        fontsize:表示字体大小
        verticalalignment:垂直对齐方式 ,参数:[ ‘center’ | ‘top’ | ‘bottom’ | ‘baseline’ ]
        horizontalalignment:水平对齐方式 ,参数:[ ‘center’ | ‘right’ | ‘left’ ]
        """
    plt.tight_layout()
    plt.ylabel('True label')
    plt.xlabel('Predict label')

# 计算混淆矩阵
tree_matrix = confusion_matrix(y_test, tree_yhat, labels=[0, 1])
knn_matrix = confusion_matrix(y_test, knn_yhat, labels=[0, 1])
lr_matrix = confusion_matrix(y_test, lr_yhat, labels=[0, 1])
svm_matrix = confusion_matrix(y_test, svm_yhat, labels=[0, 1])
rf_matrix = confusion_matrix(y_test, rf_yhat, labels=[0, 1])
xgb_matrix = confusion_matrix(y_test, xgb_yhat, labels=[0, 1])
# 通过rc配置文件来自定义图形的各种默认属性
plt.rcParams['figure.figsize'] = (6, 6)
classes = ['Non-fraud(0)', 'Fraud(1)']
tree_cm_plot = plot_confusion_matrix(tree_matrix,classes =classes, title='Decision Tree')
plt.savefig('tree_cm_plot.png')
plt.show()
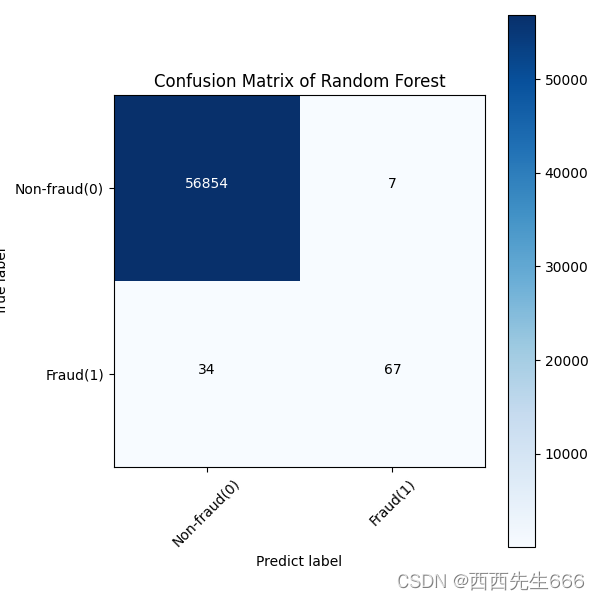
图中横坐标是predict label,纵坐标是true label;

knn_cm_plot = plot_confusion_matrix(knn_matrix,classes =classes, title='KNN')
plt.savefig('knn_cm_plot.png')
plt.show()

lr_cm_plot = plot_confusion_matrix(lr_matrix,classes =classes, title='Logistic Regression')
plt.savefig('lr_cm_plot.png')
plt.show()

svm_cm_plot = plot_confusion_matrix(svm_matrix,classes =classes, title='SVM')
plt.savefig('svm_cm_plot.png')
plt.show()

rf_cm_plot = plot_confusion_matrix(rf_matrix,classes =classes, title='Random Forest')
plt.savefig('rf_cm_plot.png')
plt.show()
xgb_cm_plot = plot_confusion_matrix(xgb_matrix,classes =classes, title='XGBoost')
plt.savefig('xgb_cm_plot.png')
plt.show()


 358
358


 被折叠的 条评论
为什么被折叠?
被折叠的 条评论
为什么被折叠?
 到【灌水乐园】发言


