


参数方程形式给出的曲线
可以直接用plot3(x(t),y(t),z(t))或者来解决。
 t=0:pi/50:10*pi;
 figure;
 grid on; %加网格
 plot3(sin(t),cos(t),t); %绘制曲线图,如果需要网格要添加上行
 stem3(sin(t),cos(t),t); %绘制火柴杆图,自带网格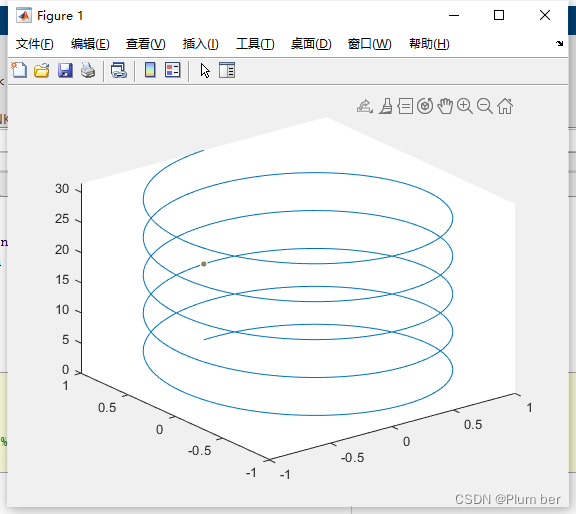

绘制二元方程
 x=-8:0.5:8;
 y=-8:0.5:8;
 [xx,yy]=meshgrid(x,y); %生成一个每个xoy平面上每个点的坐标矩阵;
 figure;

 c=sqrt(xx.^2+yy.^2)+eps; %加eps避免为0
 z=sin(c)./c;
 subplot(2,2,1);  %将多个函数话画一个平面上,表示这个平面上有两行两列四个函数图像,下面的图像为第一个函数图像
 surf(xx,yy,z); %绘制三维曲面图,着色的三维曲面
 title('Surfplot'); %命名曲面图
 subplot(2,2,2); %下面的图像为第二个函数图像
 mesh(xx,yy,z); %一排排的彩色曲线组成的网格图
 title('Meshplot'); %命名曲网格图
 subplot(2,2,3); %下面的图像为第二个函数图像
 surf(xx,yy,z);
 title('Surplot with shading interp');
 shading flat; %使图像表面光滑
subplot(2,2,4);
contour(xx,yy,z);%绘制等高线图
title('Meshplot ');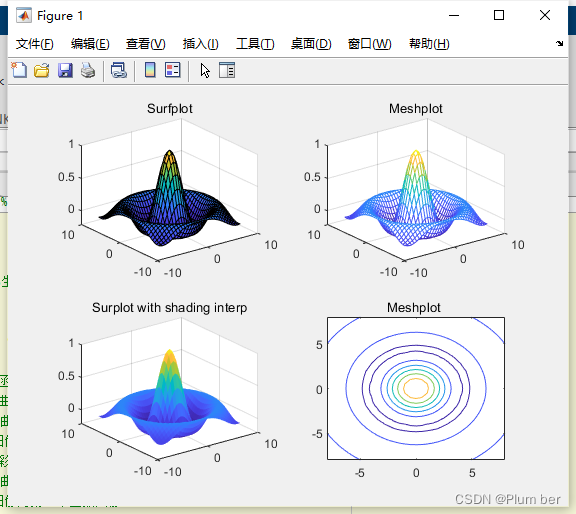
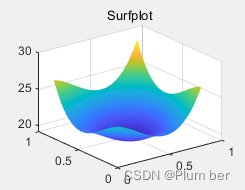
复杂一点函数图像
 x=0:0.02:0.8;
 y=0:0.02:0.8;
 [xx,yy]=meshgrid(x,y); %生成一个每个xoy平面上每个点的坐标矩阵;
 figure;

 % z=25.05*2.384.*cosh(x^1.53-0.3007).*cosh(y^1.53-0.3007)-40.57
 c=cosh(xx.^1.53-0.3007);
 d=cosh(yy.^1.53-0.3007);
 z=25.05*2.384*c.*d-40.57;

 subplot(2,2,1);  %将多个函数话画一个平面上,表示这个平面上有两行两列四个函数图像,下面的图像为第一个函数图像
 surf(xx,yy,z); %绘制三维曲面图,着色的三维曲面
 title('Surfplot'); %命名曲面图
 subplot(2,2,2); %下面的图像为第二个函数图像
 mesh(xx,yy,z); %一排排的彩色曲线组成的网格图
 title('Meshplot'); %命名曲网格图
 subplot(2,2,3); %下面的图像为第二个函数图像
 surf(xx,yy,z);
 title('Surplot with shading interp');
 shading flat; %使图像表面光滑
subplot(2,2,4);
contour(xx,yy,z);%绘制等高线图
title('Meshplot ');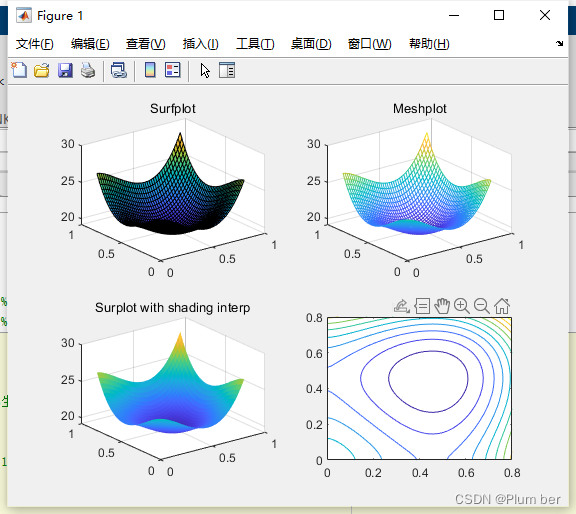
绘制时遇到的一点问题:
1.如果栅格取得太密![]() 就会导致曲面图糊成黑色
就会导致曲面图糊成黑色
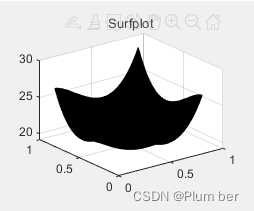
可以通过将栅格取稀疏或者添加语句 shading flat;去除栅格来解决。
 x=0:0.001:0.8;
 y=0:0.001:0.8;
 [xx,yy]=meshgrid(x,y); %生成一个每个xoy平面上每个点的坐标矩阵;
 figure;

 % z=25.05*2.384.*cosh(x^1.53-0.3007).*cosh(y^1.53-0.3007)-40.57
 c=cosh(xx.^1.53-0.3007);
 d=cosh(yy.^1.53-0.3007);
 z=25.05*2.384*c.*d-40.57;

 subplot(2,2,1);  %将多个函数话画一个平面上,表示这个平面上有两行两列四个函数图像,下面的图像为第一个函数图像
 surf(xx,yy,z); %绘制三维曲面图,着色的三维曲面
 shading flat;
2. 上述所有写到的三维绘图函数中,只有plot3和contour所绘制图象是不带网格的,如果需要网格,可以增添语句grid on;
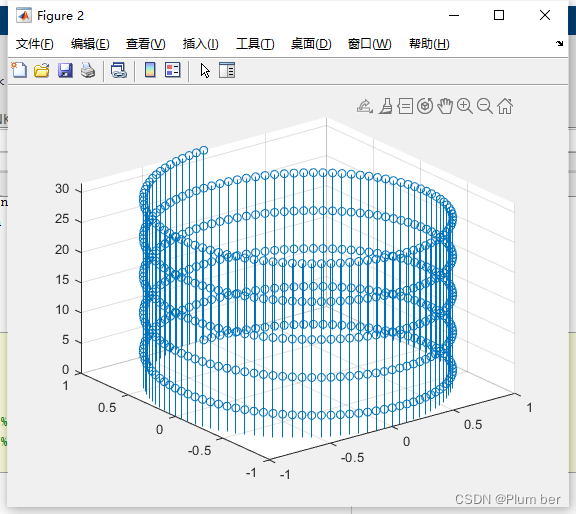
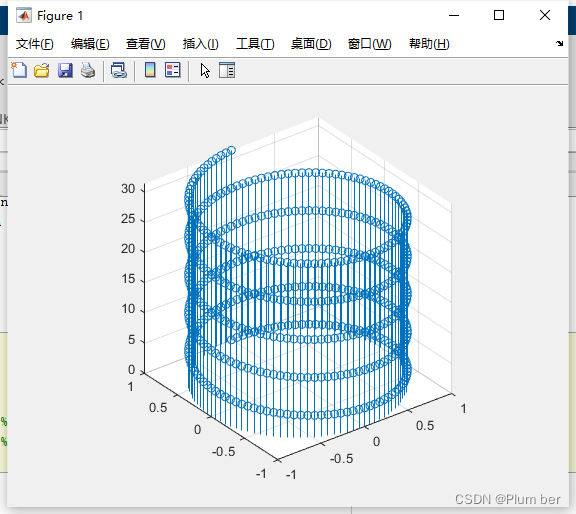
3.如果想使图形看起来更方一点,更立体一点可以加语句 axis square;
 t=0:pi/50:10*pi;
 figure;
 grid on; %加网格
 plot3(sin(t),cos(t),t); %绘制曲线图,如果需要网格要添加上行
 stem3(sin(t),cos(t),t); %绘制火柴杆图,自带网格
 axis square;
前后变化如下:


 2196
2196

 被折叠的 条评论
为什么被折叠?
被折叠的 条评论
为什么被折叠?
 到【灌水乐园】发言


