


Seaborn是python提供的一个很棒的可视化库。它有几种类型的绘图,通过这些绘图,它提供了惊人的可视化能力。其中一些包括计数图,散点图,配对图,回归图,矩阵图等等。本文讨论了Seaborn中的矩阵图。
示例1: 热图
热图是一种显示某种矩阵图的方法。要使用热图,数据应采用矩阵形式。矩阵的意思是索引名和列名必须以某种方式匹配,这样我们填充在单元格中的数据才是相关的。让我们看一个例子来更好地理解这一点。
# import the necessary libraries
import seaborn as sns
import matplotlib.pyplot as plt % matplotlib inline
# load the tips dataset
dataset = sns.load_dataset('tips')
# first five entries of the tips dataset
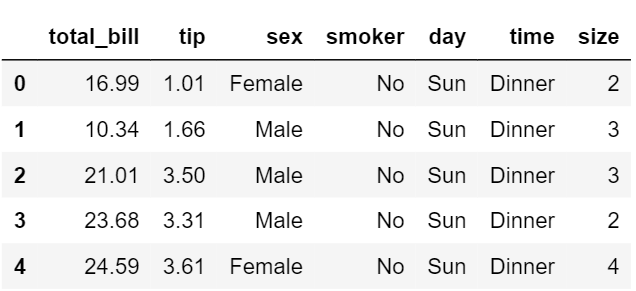
dataset.head()
# correlation between the different parameters
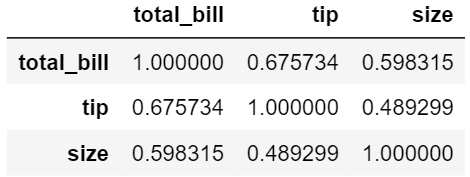
tc = dataset.corr()
# plot a heatmap of the correlated data
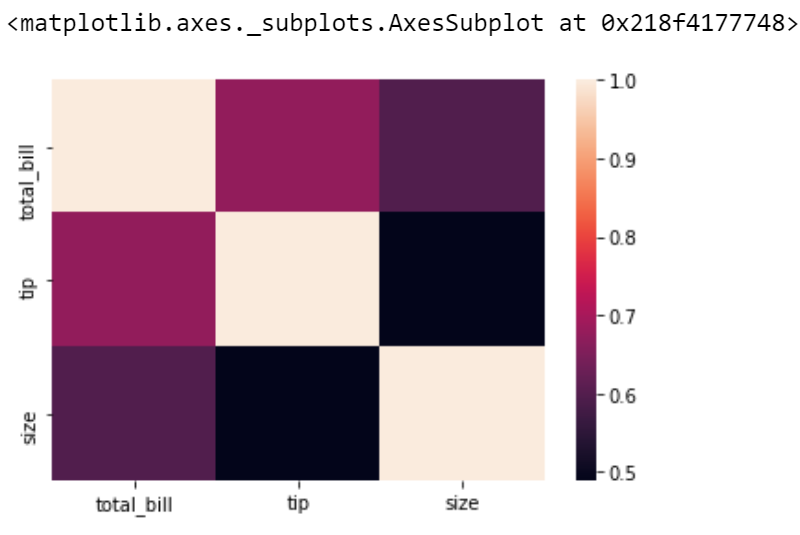
sns.heatmap(tc)
数据集前5条数据:
关系矩阵:
关系矩阵的热图:
为了获得更好的热图可视化,我们可以添加annot,线宽和线条颜色等参数。
# import the necessary libraries
import seaborn as sns
import matplotlib.pyplot as plt % matplotlib inline

# load the tips dataset
dataset = sns.load_dataset('tips')

# first five entries of the tips dataset
dataset.head()

# correlation between the different parameters
tc = dataset.corr()
sns.heatmap(tc, annot = True, cmap ='plasma',
            linecolor ='black', linewidths = 1)
说明:
- annot用于注释属于这些单元格的实际值
- cmap用于你想要的颜色映射,如coolwarm,plasma,magma等。
- linewidth用于设置分隔单元格的线的宽度。
- linecolor用于设置分隔单元格的线条的颜色。
下面是一个显示这些属性的图。
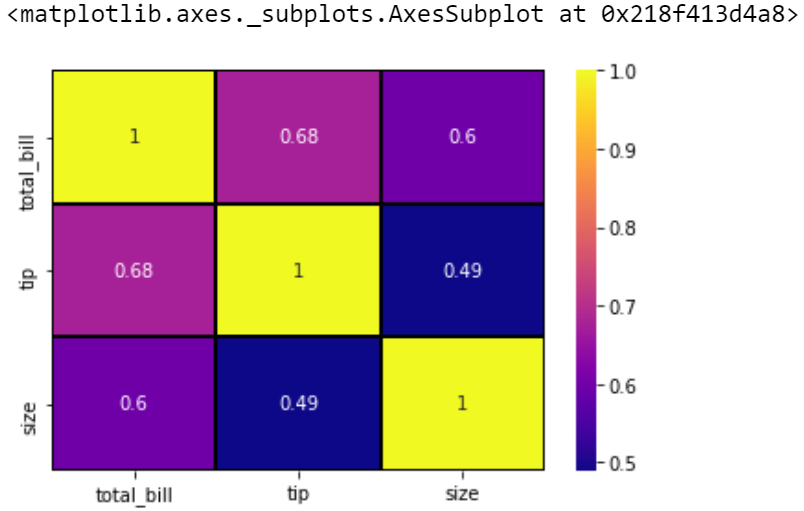
所以我们可以说,热图所做的就是根据梯度为单元格着色,并使用一些参数来增加数据的可视化。
示例2:聚类图
聚类图使用层次聚类。它根据行和列的相似性执行聚类。
# import the necessary libraries
import pandas as pd
import seaborn as sns
import matplotlib.pyplot as plt % matplotlib inline
# load the flights dataset
fd = sns.load_dataset('flights')
# make a dataframe of the data
df = pd.pivot_table(values ='passengers', index ='month',
columns ='year', data = fd)
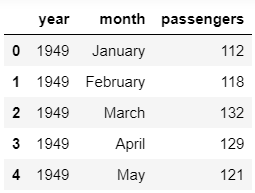
# first five entries of the dataset
df.head()
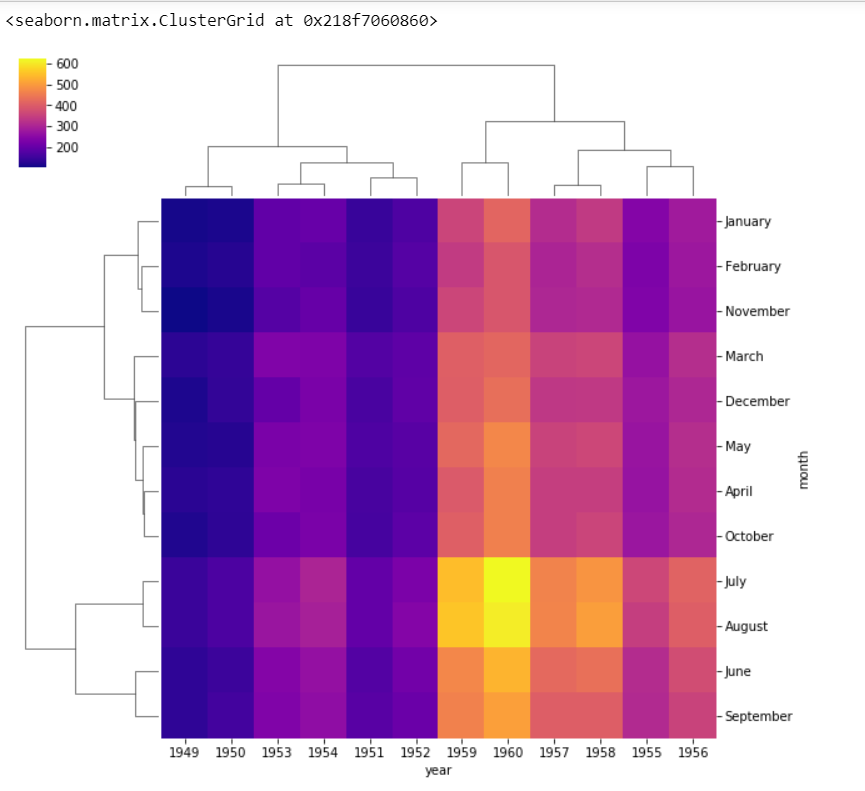
# make a clustermap from the dataset
sns.clustermap(df, cmap ='plasma')
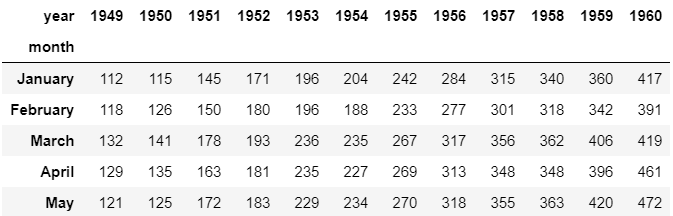
使用数据透视表创建的矩阵(前五个条目)
聚类图
我们还可以通过使用standard_scale参数来更改颜色条的比例。
# import the necessary libraries
import pandas as pd
import seaborn as sns
import matplotlib.pyplot as plt % matplotlib inline

# load the flights dataset
fd = sns.load_dataset('flights')

# make a dataframe of the data
df = pd.pivot_table(values ='passengers',
                    index ='month', columns ='year', data = fd)

# first five entries of the dataset
df.head()

# make a clustermap from the dataset
sns.clustermap(df, cmap ='plasma', standard_scale = 1)
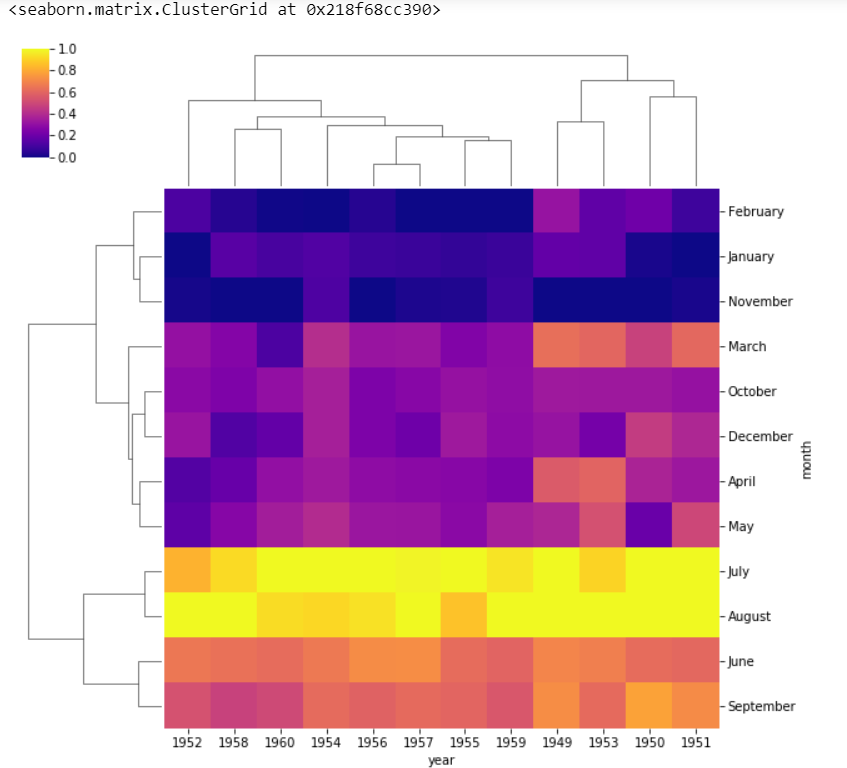
standard_scale = 1标准化从0到1范围的数据。我们可以看到,月份和年份不再按顺序排列,因为它们是根据聚类图的相似性进行聚类的。
因此,我们可以得出结论,热图将按照我们给予的顺序显示事物,而聚类图则根据相似性对数据进行聚类。


 1911
1911


 被折叠的 条评论
为什么被折叠?
被折叠的 条评论
为什么被折叠?
 到【灌水乐园】发言


