


目录
- 1、Keras
- 2、波士顿房价数据集:
- 3、鸢尾花数据集
- 4、MNIST数据集
1、Keras
keras:是一个高层的神经网络和深度学习库(其实就是提供大量的数据,弥补测试时数据不足),其中集成的数据集:
| 序号 | 名称 | 说明 |
|---|---|---|
| 1 | boston_housing | 波士顿房价数据集 |
| 2 | CIFAR10 | 10种类别的图片集 |
| 3 | CIFAR100 | 100种类别的图片集 |
| 4 | MNIST | 手写数字图片集 |
| 5 | Fashion-MNIST | 10种时尚类别的图片集 |
| 6 | IMDB | 电影点评数据集 |
| 7 | reuters | 特殊路透社新闻数据集 |
2、波士顿房价数据集:
2.1、数据集简述
- boston_housing.npz包含506条数据,每条数据包含14个变量(如下表),14个变量中前13个是“房屋属性”最后一个是“房价”。
| 序号 | 变量名 | 说明 | 示例 |
|---|---|---|---|
| 1 | CRIM | 城镇人均犯罪率 | 0.00632 |
| 2 | ZN | 超过25000平方英尺的住宅用地所占比例 | 18.0 |
| 3 | INDUS | 城镇非零售业的商业用地所占比例 | 2.31 |
| 4 | CHAS | 是否被 Charles河流穿过(取值1:是;取值0:否) | 0 |
| 5 | NOX | 一氧化氮浓度 | 0.538 |
| 6 | RM | 每栋住宅的平均房间数 | 6.575 |
| 7 | AGE | 早于1940年建成的自住房屋比例 | 65.2 |
| 8 | DIS | 到波士顿5个中心区域的加权平均距离 | 4.0900 |
| 9 | RAD | 到达高速公路的便利指数 | 1 |
| 10 | TAX | 每10000美元的全值财产税率 | 296 |
| 11 | PTRATIO | 城镇中师生比例 | 15.3 |
| 12 | B | 反映城镇中的黑人比例的指标,越靠近0.63越小;B=1000*(BK-0.63)平方,其中BK是黑人的比例 | 396.90 |
| 13 | LSTAT | 低收入人口的比例 | 7.68 |
| 14 | MEDV | 自住房屋房价的平均房价(单位为1000美元) | 24 |
2.2、加载数据: .load_data(test_split=0.2)
默认加载数据中20%为测试集
import tensorflow as tf
boston_housing=tf.keras.datasets.boston_housing  #tf.keras.datasets是前缀,boston_housing数据集名称
(train_x,train_y),(test_x,test_y)=boston_housing.load_data()
注意:第一次运行load_data()时,由于本地没有数据会自动从网络获取数据,但是国内访问可能有问题,所以会因为长时间而报错:
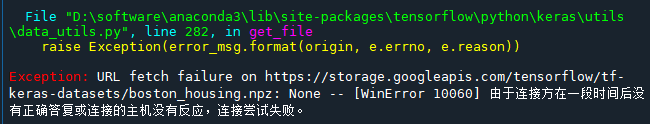
此时,可以百度,自行下载相关数据集(https://github.com/yuxiwang66/boston_housing),再将文件boston_housing.npz放到路径C:\Users\你自己的用户名文件夹.keras\datasets中(我的是C:\Users\ZHUIAO.keras\datasets),再运行data_load()即可。
- 波士顿房价数据集:划分为训练集和测试集,而每个集又包括“房屋属性”和“房价”,所以上述用(train_x,train_y)接收训练数据集、(test_x,test_y)接收测试数据集:
>>>print("Training set:{} Testing set:{}" .format(len(train_x),len(test_x)))
Training set:404 Testing set:102   #默认训练集有404条数据,测试集有102条
- 设置所有数据为训练集,则测试集为0: .load_data(test_split=0)
>>>(train_x,train_y),(test_x,test_y)=boston_housing.load_data(test_split=0)
>>>print("Training set:{} Testing set:{}" .format(len(train_x),len(test_x)))
Training set:506 Testing set:0
>>>type(train_x)
numpy.ndarray   #train_x是数组类型,train_y也是
>>>print("Shape : train_x is {},train_y is {}" .format(train_x.shape,train_y.shape))
Shape : train_x is (506, 13),train_y is (506,) #train_x是506*13的二维数组,train_y是长度为506的 一维数组
- 平均房间数与房价之间的关系:
import matplotlib.pyplot as plt           #导入绘图库
import tensorflow as tf                   #导入TensorFlow库
boston_housing=tf.keras.datasets.boston_housing  #加载数据集
(train_x,train_y),(test_x,test_y)=boston_housing.load_data(test_split=0)

plt.figure(figsize=(5,5))          #绘图尺寸
plt.scatter(train_x[:,5], train_y) #散点图描点

plt.xlabel("RM")                  #坐标轴
plt.ylabel("Price($1000's")
plt.title("Rm-Price")             #标题
plt.show()                        #显示
2.3、效果图:

2.4、代码:
import matplotlib.pyplot as plt           #导入绘图库
import tensorflow as tf                   #导入TensorFlow库

boston_housing=tf.keras.datasets.boston_housing  #加载数据集
(train_x,train_y),(_,_)=boston_housing.load_data(test_split=0)  #Python允许变量名为"_"

plt.rcParams['font.sans-serif']='SimHei'
plt.rcParams['axes.unicode_minus']=False

titles=["CRIM","ZN","INDUS","CHAS","NOX","RM","AGE",         #子图标题数组
        "DIS","RAD","TAX","PTRATIO","B-1000","LSTAT","MEDV"]

plt.figure(figsize=(12,12))                      #绘图尺寸

for i in range(13):                              #i=0,1,2,...12
    plt.subplot(4, 4,(i+1))
    plt.scatter(train_x[:,i], train_y)           #散点图描点
    plt.title(str(i+1)+"."+titles[i]+" - Price",loc='center') #标题
    plt.xlabel(titles[i],loc='center')                        #坐标轴标题
    plt.ylabel("Price($1000's")

plt.tight_layout(pad=3.5,rect=[0,0, 1,0.95])                 #自动调整子图位置
plt.suptitle("各个属性与房价的关系", x=0.5,y=1,fontsize=20)

plt.show()

3、鸢尾花数据集
3.1、数据集简述:
该数据集包含3种鸢尾花类别,每个类别有50个样品(即,总共3*50=150个样品),每个样品包含鸢尾花的4种属性:
花萼(Sepal)的长度、宽度
花瓣(Petal)的长度、宽度
和1个标签:
山鸢尾Setosa、变色鸢尾Versicolor、维吉尼亚鸢尾Virginica
3.2、鸢尾花数据集的加载与访问
3.2.1、get_file()函数下载数据集: tf.keras.utils.get_file(fname,origin,cache_dir)
参数:(执行时先检查本地是否有fname,若有直接返回地址,否者根据
origin地址下载,然后再返回地址) fname:下载后的文件名; origin:文件的URL地址; cache
dir:下载后文件的存储位置。 默认下载地址:C\Users\当前用户名.keras\datasets
返回值:下载后的文件在本地磁盘中的绝对路径
TRAIN_URL="http://download.tensorflow.org/data/iris_training.csv"
train_path=tf.keras.utils.get_file("iris_training.csv",TRAIN_URL)
说明:由于下载网址很多时候下不来,建议自行百度下载好文件iris.csv,再放入文件夹。(链接:https://pan.baidu.com/s/1ymEwiAW_guvUA6MgzPXkYw 提取码:hxu3,注意的是这里下载的“iris.csv”文件是训练集和测试集一起的,所以命名是iris.csv而不是iris_training.csv,下面统统改用iris.csv即可)
- 也可以用sklearn库里面的数据
from sklearn.datasets import load_iris #sklearn的鸢尾花
iris=load_iris()  #type(iris)=sklearn.utils.Bunch
#iris:
{'data': array([[5.1, 3.5, 1.4, 0.2],  #各种属性值
                [4.9, 3. , 1.4, 0.2],
                ...]),
'target': array([0, 0, 0,...]),     #对应的标签值
'target_names': array(['setosa', 'versicolor',...#target标签对应的意义
...   #还有很多属性
3.2.2、csv文件
- .csv文件是字符分隔文件,以纯文本形式存储表格数据,可以用记事本或Excel表格打开,Excel打开:
| Sepal.Length | Sepal.Width | Petal.Length | Petal.Width | Species | |
|---|---|---|---|---|---|
| 1 | 5.1 | 3.5 | 1.4 | 0.2 | setosa |
| 2 | 4.9 | 3 | 1.4 | 0.2 | setosa |
| 3 | 4.7 | 3.2 | 1.3 | 0.2 | setosa |
| 4 | 4.6 | 3.1 | 1.5 | 0.2 | setosa |
| 5 | 5 | 3.6 | 1.4 | 0.2 | setosa |
3.2.3、split()函数:
- 通过指定的分隔符对字符串进行切片,返回一个列表
>>>TRAIN_URL="http://download.tensorflow.org/data/iris_training.csv"
>>>TRAIN_URL.split('/')
['http:', '', 'download.tensorflow.org', 'data', 'iris_training.csv']
- 可以使用负索引值从下载地址中获取文件名称:
>>>fname_list=TRAIN_URL.split('/')
>>>fname_list[-1]
'iris_training.csv'
简写为:
>>>TRAIN_URL.split('/')[-1]
'iris_training.csv'
- 所以自动获取文件名,只需要改变TRAIN_URL的地址就可获得文件名:
train_path=tf.keras.utils.get_file(TRAIN_URL.split('/')[-1],TRAIN_URL)
#train_path='C:\\Users\\ZHUIAO\\.keras\\datasets\\iris.csv'
3.2.4、Pandas库:Panel Data&Data Analysis (Anaconda自带的,用于读取.csv数据集文件)
3.5.4.1、导入:
import pandas as pd
3.5.4.2、读取csv数据集: pd.read_csv(filepath_or_buffer,header,names)
3个参数的用法:
- filepath_or_buffer:文件名,可以是绝对或相对路径:
>>>pd.read_csv("C:/Users/ZHUIAO/.keras/datasets/iris.csv")
     Unnamed: 0  Sepal.Length  ...  Petal.Width    Species
0             1           5.1  ...          0.2     setosa
1             2           4.9  ...          0.2     setosa
2             3           4.7  ...          0.2     setosa
3             4           4.6  ...          0.2     setosa
4             5           5.0  ...          0.2     setosa
..          ...           ...  ...          ...        ...
145         146           6.7  ...          2.3  virginica
146         147           6.3  ...          1.9  virginica
147         148           6.5  ...          2.0  virginica
148         149           6.2  ...          2.3  virginica
149         150           5.9  ...          1.8  virginica

[150 rows x 6 columns]
返回值是一个150行*6列的表格,它的类型是二维数据表:
>>>type(df_iris)
pandas.core.frame.DataFrame   #这是pandas中一种常用的数据类型
- header指定数据中哪一行作为表格的列标题(默认header=0,第1行数据作为列标题。如果没有列标题,header设置为None即可)
- name:由于有时候第一行并不是完全是列标题,所以可以用name来自定义列标题名字:
TRAIN_URL="http://download.tensorflow.org/data/iris_training.csv"
train_path=tf.keras.utils.get_file("iris.csv",TRAIN_URL)
COLUMN_NAMES=['SepalLength','SepalWidth','PetalLength','PatalWidth','Species']
df_iris=pd.read_csv(train_path,names=COLUMN_NAMES,header=0)
#header=0:指定第一列为列标题,然后使用数组COLUMN_NAMES命名列名
#输出:
     SepalLength  SepalWidth  PetalLength  PatalWidth    Species
1            5.1         3.5          1.4         0.2     setosa
2            4.9         3.0          1.4         0.2     setosa
3            4.7         3.2          1.3         0.2     setosa
4            4.6         3.1          1.5         0.2     setosa
5            5.0         3.6          1.4         0.2     setosa
..           ...         ...          ...         ...        ...
146          6.7         3.0          5.2         2.3  virginica
147          6.3         2.5          5.0         1.9  virginica
148          6.5         3.0          5.2         2.0  virginica
149          6.2         3.4          5.4         2.3  virginica
150          5.9         3.0          5.1         1.8  virginica

[150 rows x 5 columns]
3.2.5、访问数据:
head(n=5) 读取前n行数据,默认值为5
tail(n=5) 读取后n行数据,默认值为5 使用索引和切片
df_iris[10:12] 读取行号为10-11的数据,行号以0开始
>>>df_iris.head(2)  #读取前2行数据,
   SepalLength  SepalWidth  PetalLength  PatalWidth Species
1          5.1         3.5          1.4         0.2  setosa
2          4.9         3.0          1.4         0.2  setosa
>>>df_iris.tail(1)
     SepalLength  SepalWidth  PetalLength  PatalWidth    Species
150          5.9         3.0          5.1         1.8  virginica
>>>df_iris[10:12]
    SepalLength  SepalWidth  PetalLength  PatalWidth Species
11          5.4         3.7          1.5         0.2  setosa
12          4.8         3.4          1.6         0.2  setosa
3.2.6、显示二维数据的统计信息: describe()
>>>df_iris.describe()
#依次:总数、均值、标准差、最小值、1/4分倍数、1/2分倍数、3/4分倍数、最大值
       SepalLength  SepalWidth  PetalLength  PatalWidth
count   150.000000  150.000000   150.000000  150.000000
mean      5.843333    3.057333     3.758000    1.199333
std       0.828066    0.435866     1.765298    0.762238
min       4.300000    2.000000     1.000000    0.100000
25%       5.100000    2.800000     1.600000    0.300000
50%       5.800000    3.000000     4.350000    1.300000
75%       6.400000    3.300000     5.100000    1.800000
max       7.900000    4.400000     6.900000    2.500000
3.2.7、DataFrame常用属性
| 属性 | 描述 |
|---|---|
| ndim | 数据表的维数 |
| shape | 数据表的形状 |
| size | 数据表元素的总个数 |
如下:
>>>print("ndim:{} shape:{} size:{}" .format(df_iris.ndim,df_iris.shape,df_iris.size))
ndim:2 shape:(150, 5) size:750  #df_iris是2维,150行*5列,750个元素
3.2.8、转化为NumPy数组:
>>>iris=np.array(df_iris)
>>>type(iris)
numpy.ndarray   #而df_iris是pandas.core.frame.DataFrame
#或者使用iris=df_iris.values或iris=df_iris.as_matrix()
3.3、可视化
3.3.1、色彩映射:plt.scatter(x,y,c,cmap)
3.3.1.1、camp
- cmap即colormap,如果需要在一个散点图绘制多种不同颜色的点时,设置c为一个颜色的列表/数组取值为0,1,2,…,cmap中每个字母与c的0,1,2,…一一对应:
- 也可以用cm_pt=mpl.colors.ListedColormap([“blue”,“red”]) #自定义颜色集合(蓝色,红色),参见机器学习笔记5(有道云笔记)
| 颜色 | 缩略字符 | 颜色 | 缩略字符 |
|---|---|---|---|
| blue | b | black | k |
| green | g | white | w |
| red | r | cyan | c |
| yellow | y | megenta | m |
x=np.arange(10)
y=np.arange(10)

dot_color=[0,0,1,1,2,2,0,1,2,2]  #10个数据,取值范围为0,1,2

plt.scatter(x,y,c=dot_color,cmap='brg')#0:蓝色b 1:红色r 2:绿色g
plt.show()

3.3.2、鸢尾花数据集应用,将鸢尾花种类索引为4的列作为scatter的c参数:
import matplotlib.pyplot as plt           #导入绘图库
import tensorflow as tf                   #导入TensorFlow库
import pandas as pd
import numpy as np

#TRAIN_URL="http://download.tensorflow.org/data/iris_training.csv" #由于路径不可达而弃用
train_path=tf.keras.utils.get_file("iris.csv", origin=None)   #获取文件的绝对路径
COLUMN_NAMES=['SepalLength','SepalWidth','PetalLength','PatalWidth','Species'] #列标题
df_iris=pd.read_csv(train_path,names=COLUMN_NAMES,header=0) #读取csv文件并修改列标题

iris=np.array(df_iris)  #将二维数据表类型转化为二维数组类型
colornum=np.zeros(np.shape(iris)[0])
dic_ir={'setosa':0,'versicolor':1,'virginica':2}
for i in range(np.shape(iris)[0]):
    colornum[i]=dic_ir.get(iris[i,4],-1)

plt.scatter(iris[:,2],iris[:,3],c=colornum,cmap='brg')#x花瓣长度,y花瓣宽度,c花瓣种类区分颜色
plt.title("Anderson's IrisData Set\n(Blue->Setosa|Red->Versicolor | Green->Virginica")
plt.xlabel(COLUMN_NAMES[2])
plt.ylabel(COLUMN_NAMES[3])
plt.show()

3.3.3、属性标签(花萼/花瓣 长/宽)
- 花萼(Sepal)的长度、宽度、花瓣(Petal)的长度、宽度共4种属性,组合有4*4=16种,其中主对角线4辐图像仅仅显示属性名称而不显示图像:
3.3.4、绘制一行四个子图代码:
import matplotlib.pyplot as plt           #导入绘图库
import tensorflow as tf                   #导入TensorFlow库
import pandas as pd
import numpy as np

#TRAIN_URL="http://download.tensorflow.org/data/iris_training.csv" #由于路径不可达而弃用
train_path=tf.keras.utils.get_file("iris.csv", origin=None)   #获取文件的绝对路径
COLUMN_NAMES=['SepalLength','SepalWidth','PetalLength','PatalWidth','Species'] #列标题
df_iris=pd.read_csv(train_path,names=COLUMN_NAMES,header=0) #读取csv文件并修改列标题

iris=np.array(df_iris)                         #将二维数据表类型转化为二维数组类型
ir_color=np.zeros(np.shape(iris)[0])           #ir_color是为下面scatter函数的参数c赋值
dic_ir={'setosa':0,'versicolor':1,'virginica':2}
for i in range(np.shape(iris)[0]):
    ir_color[i]=dic_ir.get(iris[i,4],-1)

fig=plt.figure('Iris Data',figsize=(15,3))   #设置画布尺寸
fig.suptitle("Anderson's IrisData Set\n(Blue->Setosa|Red->Versicolor | Green->Virginica")

for i in range(4):                          #i=0,1,2,3对应4个子图
    plt.subplot(1,4,i+1)
    if(i==0):                  #两个坐标轴属性相同时,不画散点图,只显示属性
        plt.text(0.3,0.5,COLUMN_NAMES[0],fontsize=15)
    else:
        plt.scatter(iris[:,i],iris[:,0],c=ir_color,cmap='brg')

    plt.title(COLUMN_NAMES[i])         #子图标题
    plt.ylabel(COLUMN_NAMES[0])        #子图y坐标标签

plt.tight_layout(rect=[0,0,1,0.9])     #自动调整子图
plt.show()

3.3.5、完整代码
import matplotlib.pyplot as plt           #导入绘图库
import tensorflow as tf                   #导入TensorFlow库
import pandas as pd
import numpy as np

#TRAIN_URL="http://download.tensorflow.org/data/iris_training.csv" #由于路径不可达而弃用
train_path=tf.keras.utils.get_file("iris.csv", origin=None)   #获取文件的绝对路径
COLUMN_NAMES=['SepalLength','SepalWidth','PetalLength','PatalWidth','Species'] #列标题
df_iris=pd.read_csv(train_path,names=COLUMN_NAMES,header=0) #读取csv文件并修改列标题

iris=np.array(df_iris)                         #将二维数据表类型转化为二维数组类型
ir_color=np.zeros(np.shape(iris)[0])           #ir_color是为下面scatter函数的参数c赋值
dic_ir={'setosa':0,'versicolor':1,'virginica':2}
for i in range(np.shape(iris)[0]):
    ir_color[i]=dic_ir.get(iris[i,4],-1)

fig=plt.figure('Iris Data',figsize=(12,6))   #设置画布尺寸
fig.suptitle("Anderson's IrisData Set\n(Blue->Setosa|Red->Versicolor | Green->Virginica")

for i in range(4):                          #i=0,1,2,3对应第i行子图
    for j in range(4):                       #j=0,1,2,3对应第j列子图
        plt.subplot(4,4,4*i+j+1)
        if(i==j):                  #对角线4个图,两个坐标轴属性相同,不画散点图,只显示属性
            plt.text(0.3,0.5,COLUMN_NAMES[i],fontsize=15)
        else:
            plt.scatter(iris[:,j],iris[:,i],c=ir_color,cmap='brg')

        plt.title(COLUMN_NAMES[j])         #子图标题
        plt.ylabel(COLUMN_NAMES[i])        #子图y坐标标签

plt.tight_layout(rect=[0,0,1,0.98])     #自动调整子图
plt.show()

4、MNIST数据集
4.1、下载数据集mnist.npz:
import tensorflow as tf
mnist=tf.keras.datasets.mnist
(train_x,train_y),(test_x,test_y)=mnist.load_data()
注意:第一次本地没有数据集,会自动从网络下载,显示
Downloading data from https://storage.googleapis.com/tensorflow/tf-keras-datasets/mnist.npz...........
下载缓慢,所以一般先下载好数据集,一般放在”C:\Users\用户名.keras\datasets\“,再运行上面语句,
MNIST数据集下载地址:https://pan.baidu.com/share/init?surl=27CSAC9Ng6wFYdUI0WXIww 提取码:2gsh
4.2、数据集
- 60 000条训练数据+10 000条测试数据,每个数据是2828像素灰度图像,存储在2828的二维数组
print("Training set:{},Testingset:{},\nTrain_x.shape:{},train_y.shape{},\ntrain_x.dtype={},train_y.dtype={}" .format(len(train_x),len(test_x),train_x.shape,train_y.shape,train_x.dtype,train_y.dtype))
Training set:60000,Testingset:10000,
Train_x.shape:(60000, 28, 28),train_y.shape(60000,),
train_x.dtype=uint8,train_y.dtype=uint8

显示图片:
import tensorflow as tf
import matplotlib.pyplot as plt
mnist=tf.keras.datasets.mnist
(train_x,train_y),(test_x,test_y)=mnist.load_data()

plt.axis("off")
plt.imshow(train_x[0],cmap="gray")
plt.show()
print(train_y[0])
5  #输出


 3097
3097


 被折叠的 条评论
为什么被折叠?
被折叠的 条评论
为什么被折叠?
 到【灌水乐园】发言


