


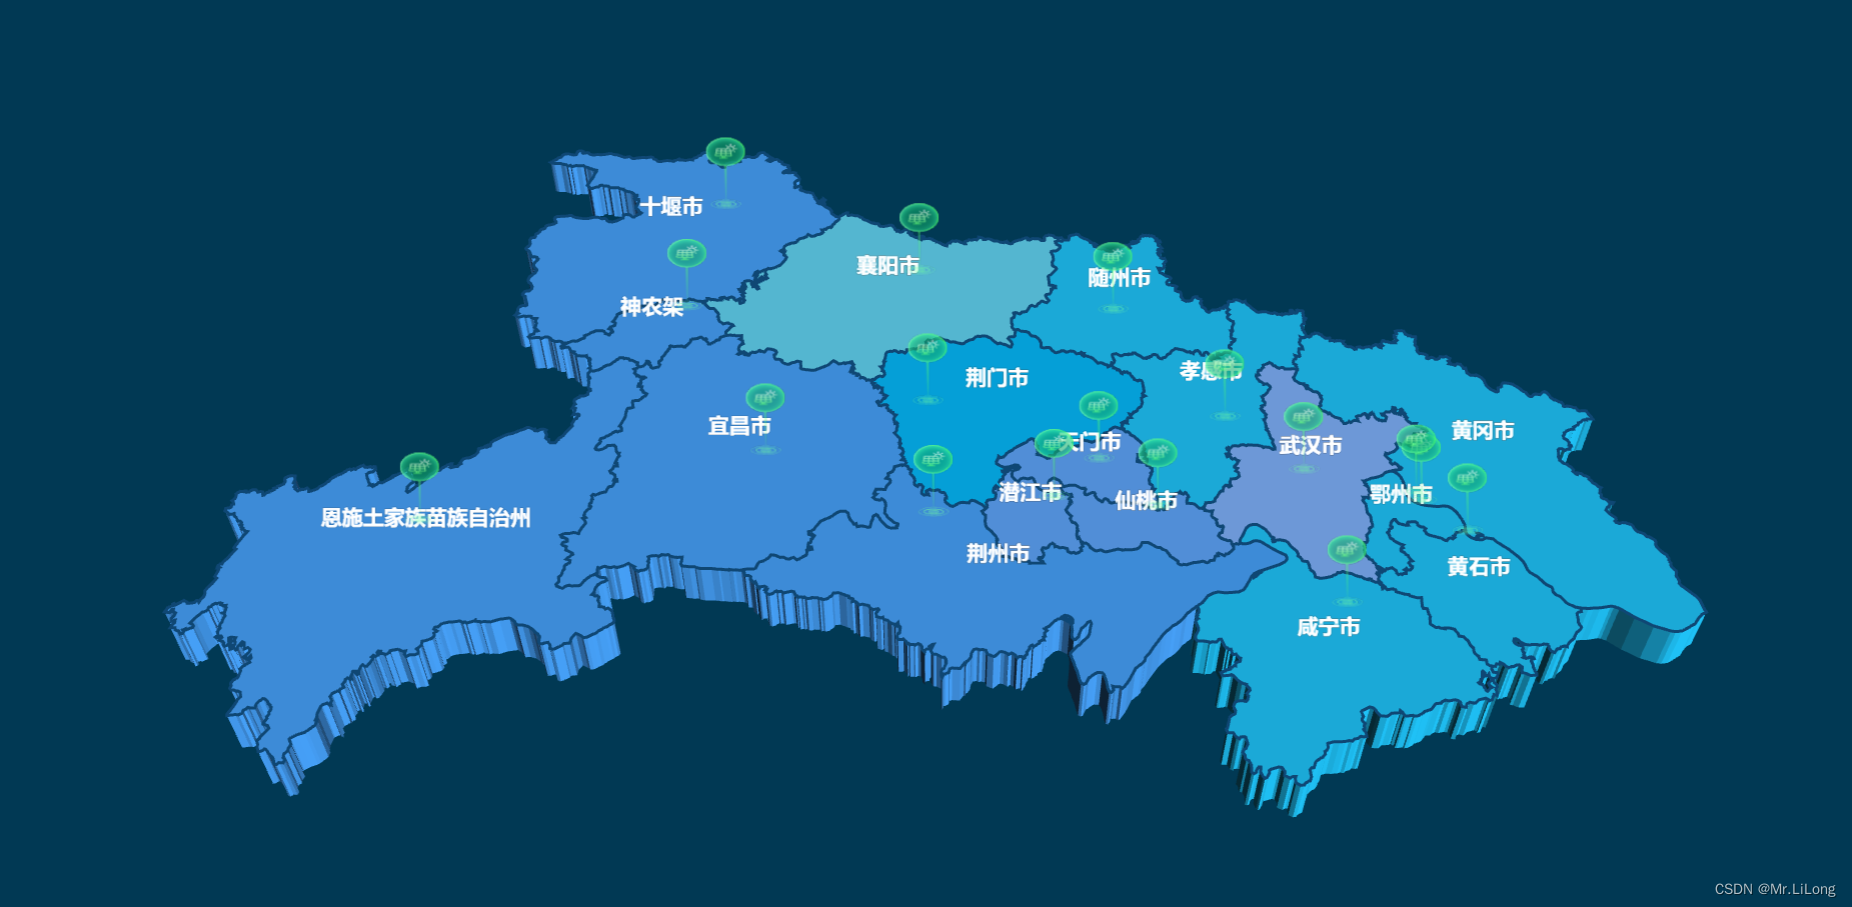
 本文介绍了如何使用ECharts库在HTML页面中创建一个3D散点图,展示了湖北省内各个地区的光伏辐射强度数据,通过地图标记和自定义tooltip显示详细信息。
效果图
<!DOCTYPE html>
<html>
	<head>
		<meta charset="utf-8" />
		<title></title>
		<link rel="stylesheet" href="/css/styles.css">
		<style type="text/css">
			.custom-tooltip-bk-box {
				box-shadow: none !important;
				border: none;
				border-width: 0 !important;
			}

			.custom-tooltip-box {
				padding-right: 20px;
				background: url(./img/dw-bg.png) no-repeat;
				background-size: 100% 100%;
				width: 231px;
				height: 123px;

				p,
				span {
					line-height: 25px;
					color: #fff;
					margin: 0;
					padding: 0;
					font-weight: 400;
					font-size: 14px;
				}

			}

			.tooltip-title {
				color: #FFF;
				font-size: 14px;
				font-weight: 600;
				height: 30px;
				line-height: 30px;
			}

			.tooltip-content div {
				display: flex;
				justify-content: space-between;
				align-items: center;
			}

			.tooltip-content p:nth-child(1) {
				width: 90px;
				text-align: left;
			}

			.tooltip-content p:nth-child(2) {
				background-image: linear-gradient(to bottom, #F2F5F7, #32C8FC);
				-webkit-background-clip: text;
				color: transparent;
				font-size: 16px;
				font-weight: 600;
				text-align: center;
				width: 50px;
			}

			.tooltip-content p:nth-child(3) {
				width: 30px;
				text-align: left;
			}

			.tooltip-title,
			.tooltip-content {
				padding-left: 27%;

			}
		</style>
	</head>
	<body>
		<div id="main" style="width: 100%;height:100vh;"></div>

		<script src="./js/echarts.min.js"></script>
		<script src="./js/jquery-3.6.0.min.js"></script>
		<script src="./js/echarts-gl.min.js"></script>

		<script type="text/javascript">
			let ticon = './img/shebei-red.png'
			var mapData = 'js/hubei.json';
			// 你的jQuery代码
			$(document).ready(function() {
				getMap();
			});

			function getMap() {
				$.getJSON(mapData, function(geoJson) {
					initEcharts(geoJson);
				})
			}

			function initEcharts(geoJson) {
				console.log(geoJson);
				let dataMap = geoJson.features
				var scatterData = [];

				let regions = []
				let colorCity1 = ['孝感市', '黄冈市', '鄂州市', '黄石市', '咸宁市', '随州市']
				let colorCity2 = ['武汉市']
				let colorCity3 = ['荆州市', '神农架', '十堰市', '恩施土家族苗族自治州', '宜昌市']
				let colorCity4 = ['荆门市']
				let colorCity5 = ['潜江市', '仙桃市', '天门市']
				let colorCity6 = ['襄阳市']
				let icons1 = ['十堰市', '荆州市', '潜江市', '仙桃市', '鄂州市', '黄石市', '黄冈市']
				let icons2 = ['神农架', '恩施土家族苗族自治州', '随州市', '天门市', '咸宁市']
				let icons3 = ['宜昌市', '荆门市', '襄阳市', '武汉市']
				let icons4 = ['孝感市']
				// let icons5 = ['武汉市']
				for (var i = 0; i < dataMap.length; i++) {
					let el = dataMap[i]
					let icon = ''
					let name = el.properties.name
					scatterData.push({
						name: el.properties.name,
						value: el.properties.center,
					})
					let obj = {
						name: name,
						itemStyle: {
							color: '',
						},
						emphasis: {
							itemStyle: {
								color: '',
							},
							label: {
								show: true,
								formatter: (v) => {
									return `{b1|${v.name}}`
								},
								distance: -(18 + 20),
								rich: {
									b1: {
										width: '100',
										backgroundColor: {
											image: ''
										},
										align: 'center',
										color: "#fff",
										fontWeight: 600,
										fontSize: 14,
										padding: [5, 5]
									},
								}
							},
						},
						label: {
							show: true,
							formatter: (v) => {
								return `{b1|${v.name}}`
							},
							distance: -(18 + 20),
							rich: {
								b1: {
									backgroundColor: {
										image: ''
									},
									width: '100',
									align: 'center',
									color: "#fff",
									fontWeight: 600,
									fontSize: 14,
									padding: [5, 5]
								},
							}
						},
					}
					let color = ""
					if (colorCity1.includes(name)) {
						colorStops = [{
								offset: 0,
								color: 'rgb(26,158,203, 1)', // 0% 处的颜色
							},
							{
								offset: 1,
								color: 'rgb(26,158,203, 0.8)', // 100% 处的颜色
							},
						]
						color = 'rgb(32, 200, 255)'
					}
					if (colorCity2.includes(name)) {
						colorStops = [{
								offset: 0,
								color: 'rgb(87,136,215, 1)', // 0% 处的颜色
							},
							{
								offset: 1,
								color: 'rgb(87,136,215, 0.8)', // 100% 处的颜色
							},
						]
						color = '#81B4FF'
					}
					if (colorCity3.includes(name)) {
						colorStops = [{
								offset: 0,
								color: 'rgb(20,146,211, 1)', // 0% 处的颜色
							},
							{
								offset: 1,
								color: 'rgb(20,146,211, 0.8)', // 100% 处的颜色
							},
						]
						color = '#48A5FF'
					}
					if (colorCity4.includes(name)) {
						colorStops = [{
								offset: 0,
								color: 'rgb(13,114,207, 1)', // 0% 处的颜色
							},
							{
								offset: 1,
								color: 'rgb(13,114,207, 0.8)', // 100% 处的颜色
							},
						]
						color = 'rgb(6, 189, 255)'
					}
					if (colorCity5.includes(name)) {
						colorStops = [{
								offset: 0,
								color: 'rgb(36,116,185, 1)', // 0% 处的颜色
							},
							{
								offset: 1,
								color: 'rgb(36,116,185, 0.8)', // 100% 处的颜色
							},
						]
						color = '#60a8ff'
					}
					if (colorCity6.includes(name)) {
						colorStops = [{
								offset: 0,
								color: 'rgb(3,130,170, 1)', // 0% 处的颜色
							},
							{
								offset: 1,
								color: 'rgb(3,130,170, 0.8)', // 100% 处的颜色
							},
						]
						color = '#64D8F7'
					}
					// obj.itemStyle.areaColor.colorStops = colorStops
					obj.itemStyle.color = color
					obj.emphasis.itemStyle.color = color

					if (icons1.includes(name)) {
						icon = './img/ningxia/1.png'
					}
					if (icons2.includes(name)) {
						icon = './img/ningxia/2.png'
					}
					if (icons3.includes(name)) {
						icon = './img/ningxia/3.png'
					}
					if (icons4.includes(name)) {
						icon = './img/ningxia/4.png'
					}
					// if(icons5.includes(name)) {
					// 	icon = './img/shenghui.png'
					// }
					obj.label.rich.b1.backgroundColor.image = icon
					obj.emphasis.label.rich.b1.backgroundColor.image = icon
					regions.push(obj)
				}

				echarts.registerMap('湖北', geoJson);
				// 基于准备好的dom,初始化echarts实例
				var myChart = echarts.init(document.getElementById('main'));
				myChart.hideLoading();

				// 指定图表的配置项和数据
				var option = {
					backgroundColor: '#013954',
					tooltip: {
						className: "custom-tooltip-bk-box", //添加一个类名
						backgroundColor: "rgba(255,255,255,0)",
						trigger: 'item', // 鼠标移动时触发
						// 鼠标移到图里面的浮动提示框
						// formatter详细配置: https://echarts.baidu.com/option.html#tooltip.formatter
						formatter(params, ticket, callback) {
							if (params.componentSubType == "scatter3D") {
								let name = params.name
								let data1 = '111'
								let data2 = '111'
								let data3 = '111'
								let htmlStr = `
							              <div class="custom-tooltip-box">
							                <div class="tooltip-title">${name}</div>
							                <div class="tooltip-content">
							                  <div >
							                    <p>光伏辐照强度</p>
							                    <p>${data1}</p>
							                    <p>W/m²</p>
							                  </div>
							                  <div >
							                    <p>当日发电量</p>
												<p>${data2}</p>
							                    <p>MWh</p>
							                  </div>
							                  <div >
							                    <p>额定容量</p>
							                    <p>${data3}</p>
							                    <p>MW</p>
							                  </div>
							                </div>
							              </div>
							            `;
								return htmlStr;
							}
						}
					},
					geo3D: {
						map: '湖北',
						aspectScale: 0.75,
						/*长宽比*/
						zoom: 1.1,
						roam: false,
						itemStyle: {
							borderColor: 'rgba(15,71,116)',
							borderWidth: 2,
						},
						regions: regions,
					},
					series: [
						{
							type: "scatter3D",
							coordinateSystem: "geo3D",
							data: scatterData,
							symbol: "rect",
							symbolSize: [32, 81],
							itemStyle: {
								color: "transparent",
							},
							label: {
								show: true,
								position: "top",
								distance: -48,
								textStyle: {
									color: "transparent",
									padding: [18, 0],
									backgroundColor: {
										image: './img/dw-gf.png',
									},
								},
							},
							emphasis: {
								label: {
									show: true,
									textStyle: {
										backgroundColor: {
											image: './img/dw-gf.png',
										},
									},
								},
							},

						},
						]
				};

				// 使用刚指定的配置项和数据显示图表。
				myChart.setOption(option);
				// 监听点击事件
				myChart.on('click', function (params) {
				    if (params.componentType === 'series') {
				        var data = params.data;
				        // 根据点击的data进行操作
				        console.log('点击了地图上的', data.name);
				    }
				});
			}
		</script>
	</body>
</html>


 9943
9943


 被折叠的 条评论
为什么被折叠?
被折叠的 条评论
为什么被折叠?
 到【灌水乐园】发言


