随想,将四个向量经过注意力机制输出后,会获得这四个向量之间相关权重矩阵,怎么可视化?
[
    [0.2276, 0.2630, 0.2277, 0.2186],
    [0.3037, 0.1941, 0.2014, 0.2605],
    [0.2428, 0.2346, 0.2105, 0.3160],
    [0.2364, 0.2941, 0.2894, 0.1616]
]
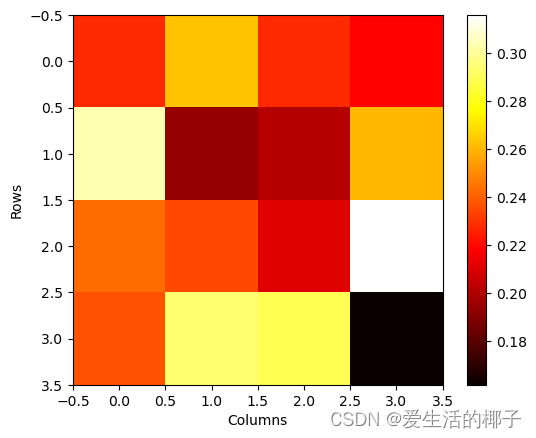
使用Python中的matplotlib库。下面是一个使用matplotlib绘制热力图的示例代码:
import matplotlib.pyplot as plt
import numpy as np
weights = np.array([
[0.2276, 0.2630, 0.2277, 0.2186],
[0.3037, 0.1941, 0.2014, 0.2605],
[0.2428, 0.2346, 0.2105, 0.3160],
[0.2364, 0.2941, 0.2894, 0.1616]
])
plt.imshow(weights, cmap='hot', interpolation='nearest')
plt.colorbar()
plt.xlabel('Columns')
plt.ylabel('Rows')
plt.show()
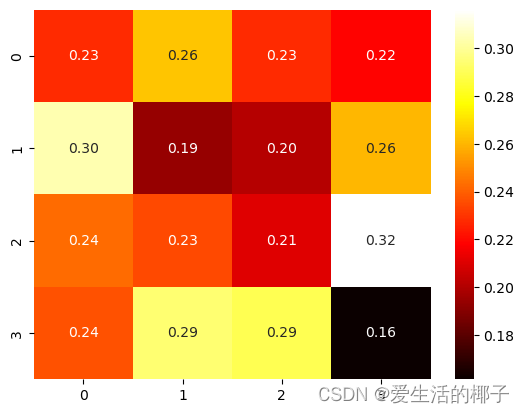
以下是使用seaborn绘制热力图的示例代码:
import seaborn as sns
import numpy as np
weights = np.array([
[0.2276, 0.2630, 0.2277, 0.2186],
[0.3037, 0.1941, 0.2014, 0.2605],
[0.2428, 0.2346, 0.2105, 0.3160],
[0.2364, 0.2941, 0.2894, 0.1616]
])
sns.heatmap(weights, cmap='hot', annot=True, fmt=".2f")
plt.show()


 1353
1353

 被折叠的 条评论
为什么被折叠?
被折叠的 条评论
为什么被折叠?
 到【灌水乐园】发言


