


y_l=latex(y)
function signal_zuoye1_1
%% 功率信号的卷积
clc
syms t T tau
syms w positive
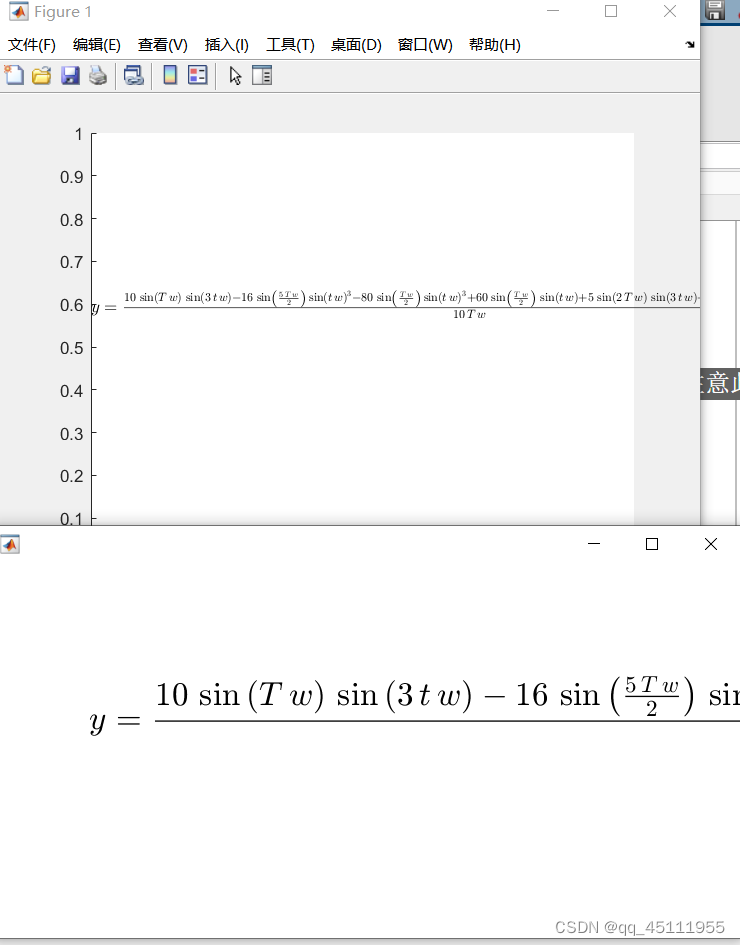
x1(t)=cos(w*t) + cos(2*w*t);
x2(t)=sin(3*w*t);
y(t)=2/T*int(x1(tau)*x2(t-tau),tau,-T/2,T/2);
y_l=latex(y)
%第一种方法,将y_l复制到mathyype
%第二种 matlab text到图片上
figure;
t1 = text(0, .6, ['$', 'y =', y_l,'$'], 'interpreter', 'latex'); % 注意此处的表达
%第三种 函数化,参考https://zhuanlan.zhihu.com/p/159137051
sym2latex(y)
end
function LaTeX = sym2latex(poly)
%SYM2LATEX 将多项式转化为LaTeX样式输出
LaTeX = latex(poly);
% 设置图幅并不显示所有无关的菜单栏等
figure;
fig = gcf;
fig.Name = '';
fig.NumberTitle= 'off';
fig.MenuBar = 'None';
fig.Position = [300, 300, 600, 300];
fig.Color = 'w';
% 不显示轴
ax = gca;
ax.XTick = [];
ax.YTick = [];
ax.XAxis.Visible = 'off';
ax.YAxis.Visible = 'off';
% 添加text函数
t1 = text(0, .6, ['$$', 'y =', LaTeX,'$$'], 'interpreter', 'latex'); % 注意此处的表达
t1.FontSize = 20;
t1.Color = 'k';
t1.FontWeight = 'Bold';
end结果:


 4370
4370


 被折叠的 条评论
为什么被折叠?
被折叠的 条评论
为什么被折叠?
 到【灌水乐园】发言


