


采用著名的数据集《鸢尾花数据集》

(二)数据样例

TIPS
stack的用法理解
https://blog.csdn.net/weixin_44330492/article/details/100126774
flat用法
https://blog.csdn.net/haiyang_duan/article/details/79224835
import numpy as np
from IPython.core.display import display
from sklearn.linear_model import LogisticRegression
import matplotlib.pyplot as plt
# 把字符串映射成三个整数 0 1 2
def iris_type(s):
it = {b'Iris-setosa': 0, b'Iris-versicolor': 1, b'Iris-virginica': 2 }
return it[s]
path = 'iris.data'
# 路径,浮点型数据,逗号分隔,第四列使用函数处理
data = np.loadtxt(path,dtype=float,delimiter=',',converters={4:iris_type})
# 1-4列划分为x 第五列划分为y axis=1表示按列划分
x, y = np.split(data, (4,), axis=1)
# 为了可视化,仅使用前两列特征 sepal length 和 sepal width
x = x[:, 0:2]
# 回归
# ravel()将列向量y转化为数组形式
logreg = LogisticRegression()
logreg.fit(x, y.ravel())
# 画图
N, M = 500, 500
x1_min, x1_max = x[:, 0].min(), x[:, 0].max()
x2_min, x2_max = x[:, 1].min(), x[:, 1].max()
t1 = np.linspace(x1_min, x1_max, N)
t2 = np.linspace(x2_min, x2_max, M)
x1, x2 = np.meshgrid(t1, t2)
# x1.flat返回x1数组扁平化后的迭代器
# for i in x1.flat:
# print(i)
# 下面要把250000个网格点列出来训练
x_test = np.stack((x1.flat, x2.flat), axis=1)
# display(x_test)
# display(x_test.shape) 结果(250000,2)
y_hat = logreg.predict(x_test) # 得到250000行的列向量
y_hat = y_hat.reshape(x1.shape) # 转化为500x500的矩阵
plt.pcolormesh(x1, x2, y_hat, shading='auto', cmap=plt.cm.prism) # 预测值画网格图
plt.scatter(x[:, 0], x[:, 1], c=y, edgecolors='k', cmap=plt.cm.prism) # 做散点图显示样本点
plt.xlabel('sepal length')
plt.ylabel('Sepal width')
plt.xlim(x1_min,x1_max)
plt.ylim(x2_min,x2_max)
plt.show()
# 训练集上的预测结果(注意这时候y_hat含义变了)
y_hat = logreg.predict(x)
# 转换为默认形式的数组,和y_hat保持一致
y = y.reshape(-1)
result = y_hat == y
c = np.count_nonzero(result)
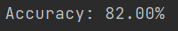
print("Accuracy: %.2f%%" % (100 * float(c) / float(len(result))))
采用前两个属性:花萼长度和宽度进行预测的精确度
图像

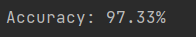
四个属性全部参与预测,正确率显著提高
声明:本博文仅供个人学习参考,部分图片/内容来自网络


 3995
3995


 被折叠的 条评论
为什么被折叠?
被折叠的 条评论
为什么被折叠?
 到【灌水乐园】发言


