


2020
paper: https://arxiv.org/pdf/2003.08612.pdf
切入点:factual correctness
提出两个模型:
- Fact-Aware Summarization model, FASUM:which extracts factual relations from the article to build a knowledge graph and integrates it into the neural decoding process.
- a Factual Corrector model, FC:that can modify abstractive summaries generated by any
summarization model to improve factual correctness.
结论:
- FASUM can generate summaries with higher factual correctness compared with state-of-the-art abstractive summarization systems.
- FC improves the factual correctness of summaries generated by various models via only modifying several entity tokens.
细节参考香侬科技,如下只记录了本文关注的点。
测评指标&结果:
测评数据集:CNN/DailyMail 和 Xsum
-
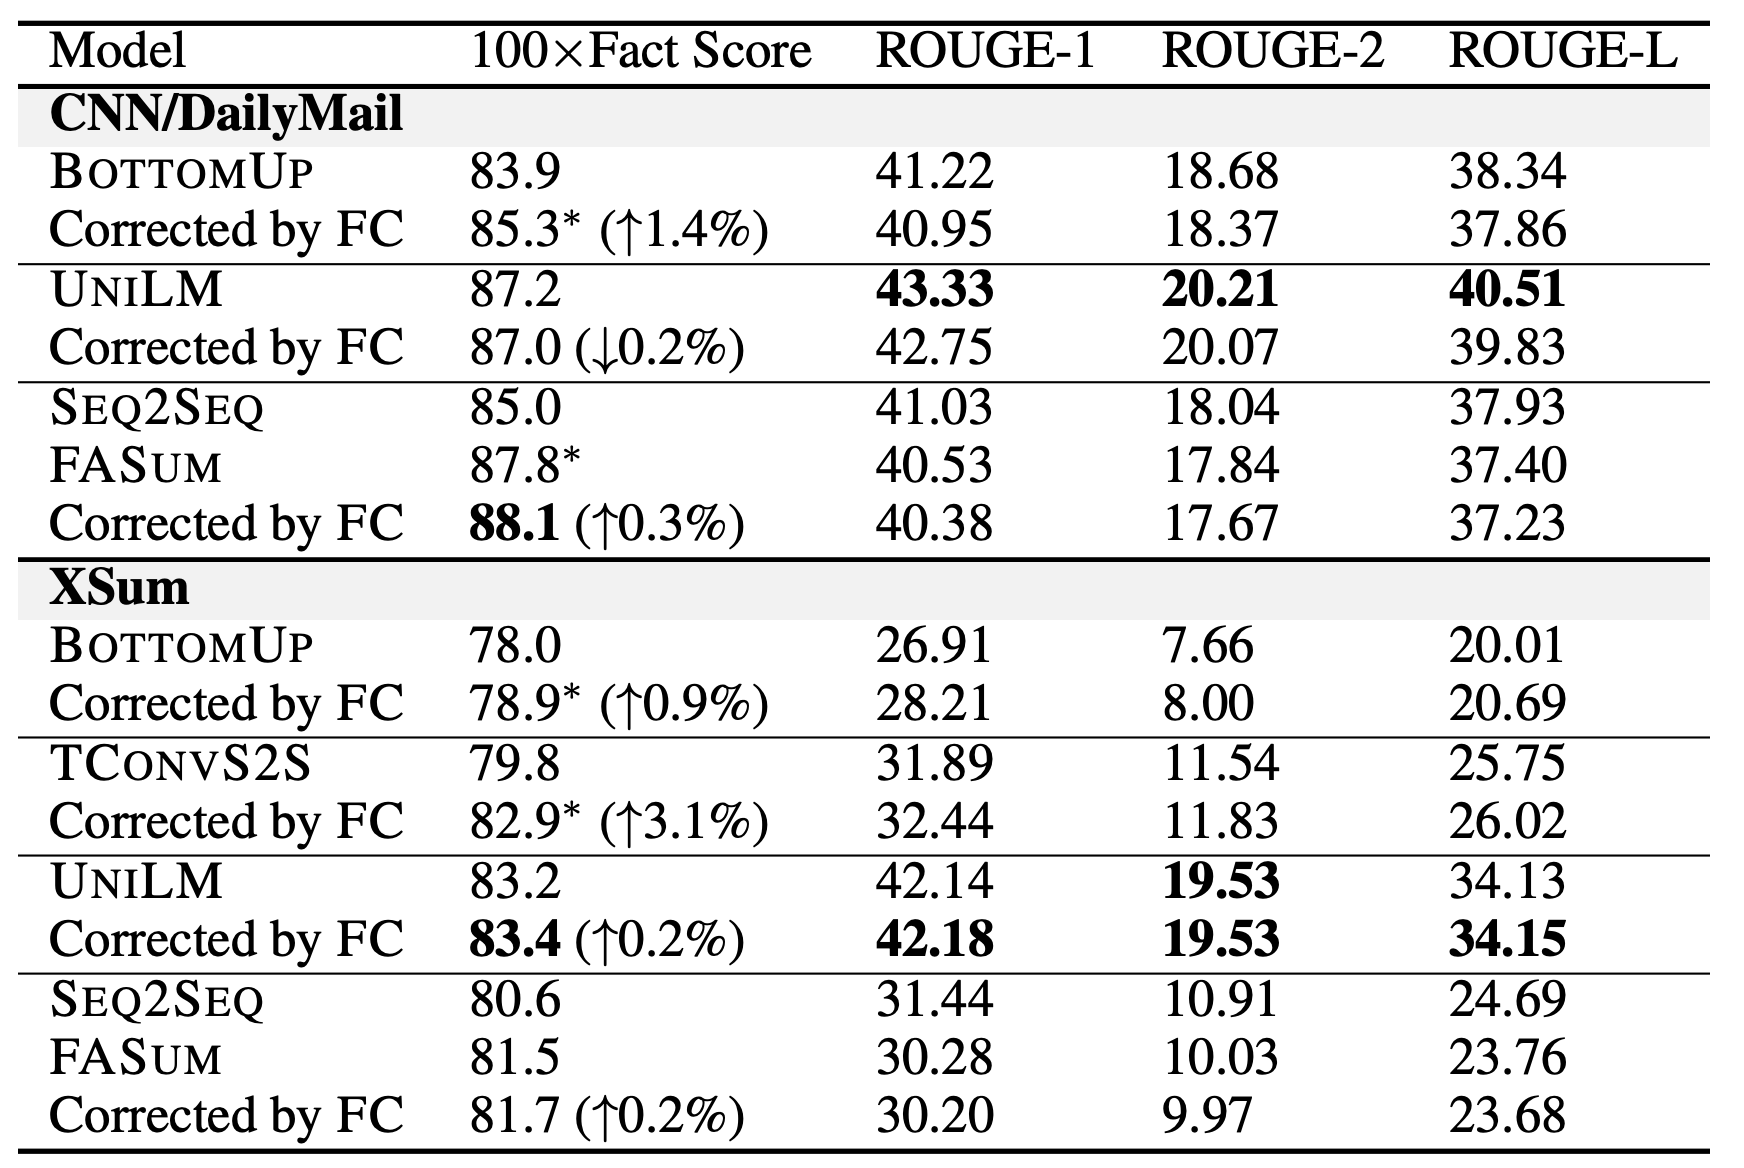
FC指标:为了测评factual correctness。FactCC模型在xxx进行fine-tune之后用于评估。可以看到整理结果:
-
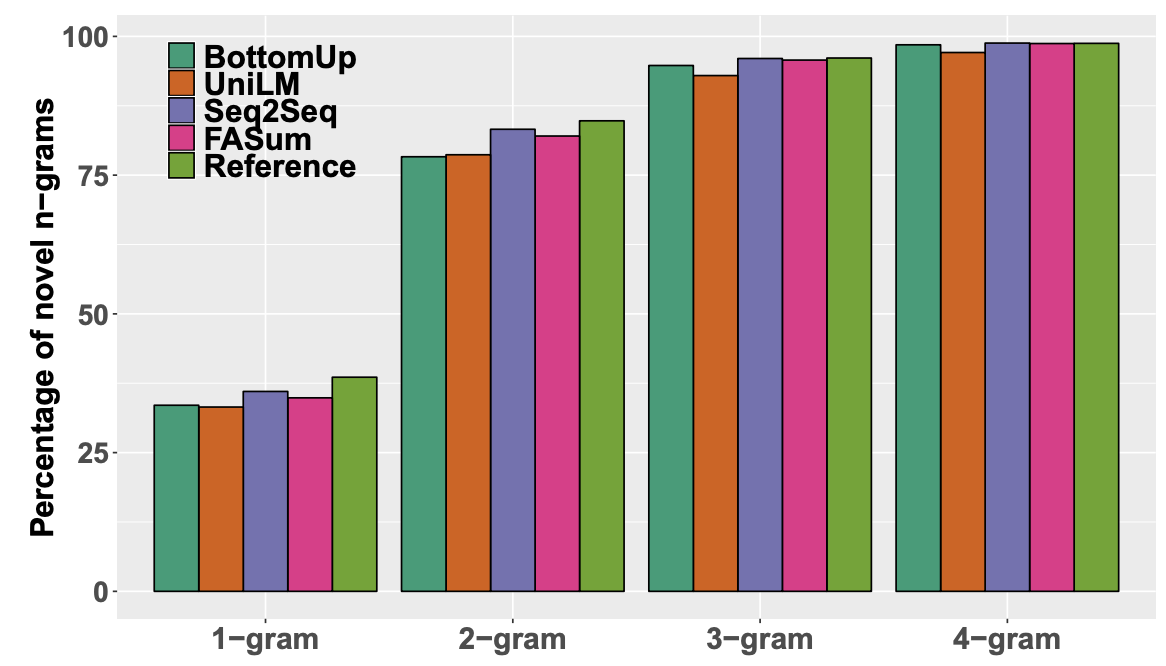
Noval n-grams:Diab论文中提到"less abstractive summaries are more factual consistent with the article",所以作者想看看是否自己的模型"boost factual correctness simply by copying
more portions of the article"。为此,计算了sum中出现article不存在的n-gram的比例,越高说明抽象程度越高。
-
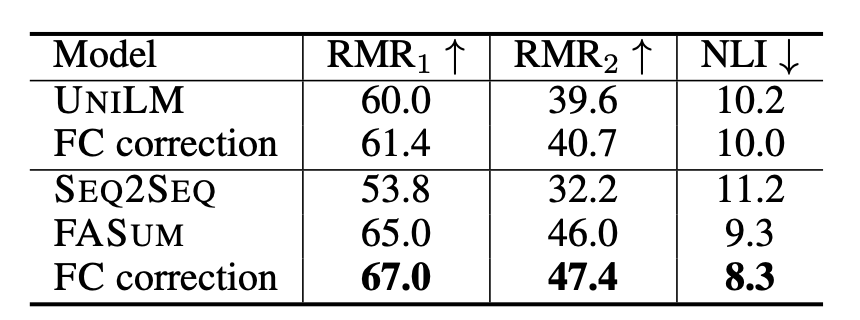
Relation Matching Rate RMR:为了测评factual correctness。将对事实的评估转化到从summary中抽取到三元组的准确率。具体来说从生成的sum中抽取出三元组合集 R s = ( s i , r i , o i ) R_s = {(s_i,r_i,o_i)} Rs=(si,ri,oi) ,同样从原始的article中抽出三元组合集 R a R_a Ra, ( s i , r i , o i ) (s_i,r_i,o_i) (si,ri,oi)和 R a R_a Ra比较会出现三种情况:Correct hit ( C C C)命中、Wrong hit ( W W W)、Miss ( M M M)就是其他情况。基于此,定义RMR为:
R M R 1 = 100 × C C + W RMR_1=100 \times \frac{C}{C+W} RMR1=100×C+WC
R M R 2 = 100 × C C + W + M RMR_2=100 \times \frac{C}{C+W+M} RMR2=100×C+W+MC
为了评估RMR指标的质量,文章计算了人评估和RMR指标之间的correlation coefficient γ \gamma γ,计算得到 γ = 0.43 \gamma=0.43 γ=0.43,说明了RMR和人工评估结果之前存在可观察的关系。 -
Natural Language Inference NLI models:为了测评factual correctness。用BERT-large模型在MNLI数据集上进行fine-tune,模型输出三种类型:entailment, neutral and contradiction. 对应到这个任务的度量上,NLI的输入和输出分别是article和sum,通过衡量NLI模型输出的contradiction的比例来衡量争取事实比例,比例越小说明 article和生成摘要的冲突越小。
-
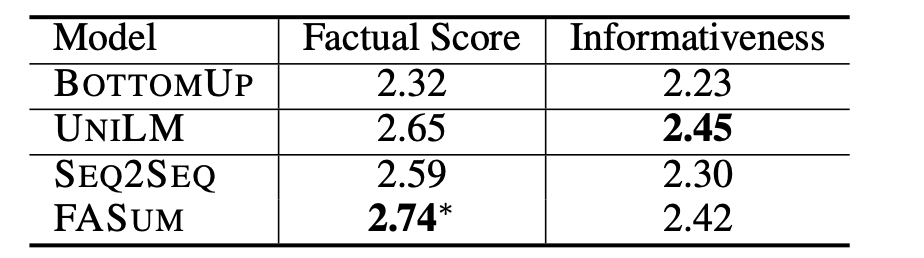
Human Evaluation:三个人,打分1-3,两个维度 factual correctness和informativeness。效果如下
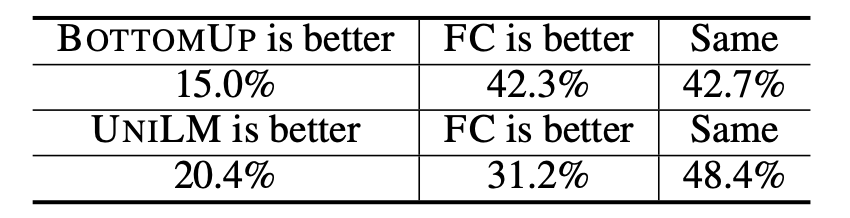
为了测评FC部分的效果,作者从BottomUP和UNILM生成的sum中随机拿了100条,之后用FC进行correct,对比了corrected前后的效果,类似于业界的GSB吧,效果如下图,说明了FC能boost


 954
954


 被折叠的 条评论
为什么被折叠?
被折叠的 条评论
为什么被折叠?
 到【灌水乐园】发言


