


A look at the data
In order to get a better understanding of the data we will be looking at throughout this lesson, let’s take a look at some of the characteristics of the dataset.
First, let’s read in the data and necessary libraries.
import numpy as np
import pandas as pd
import matplotlib.pyplot as plt
import ALookAtTheData as t
%matplotlib inline

df = pd.read_csv('./survey_results_public.csv')
df.head()
As you work through the notebook(s) in this and future parts of this program, you will see some consistency in how to test your solutions to assure they match what we acheived! In every environment, there is a solution file and a test file. There will be checks for each solution built into each notebook, but if you get stuck, you may also open the solution notebook to see how we find any of the solutions. Let’s take a look at an example.
Question 1
- Provide the number of rows and columns in this dataset.
# We solved this one for you by providing the number of rows and columns:
# You can see how we are prompted that we solved for the number of rows and cols correctly!

num_rows = df.shape[0] #Provide the number of rows in the dataset
num_cols = df.shape[1] #Provide the number of columns in the dataset

t.check_rows_cols(num_rows, num_cols)
# If we made a mistake - a different prompt will appear

flipped_num_rows = df.shape[1] #Provide the number of rows in the dataset
flipped_num_cols = df.shape[0] #Provide the number of columns in the dataset

t.check_rows_cols(flipped_num_rows, flipped_num_cols)
# If you want to know more about what the test function is expecting,
# you can read the documentation the same way as any other funtion

t.check_rows_cols?
Now that you are familiar with how to test your code - let’s have you answer your first question:
Question 2
- Which columns had no missing values? Provide a set of column names that have no missing values.
no_nulls = set(df.columns[df.isnull().mean()==0])#Provide a set of columns with 0 missing values.

t.no_null_cols(no_nulls)
Question 3
- Which columns have the most missing values? Provide a set of column name that have more than 75% if their values missing.
most_missing_cols = set(df.columns[df.isnull().mean() > 0.75])#Provide a set of columns with more than 75% of the values missing

t.most_missing_cols(most_missing_cols)
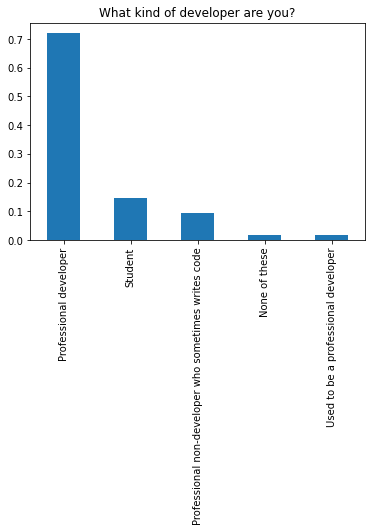
Question 4
- Provide a pandas series of the different Professional status values in the dataset. Store this pandas series in status_vals. If you are correct, you should see a bar chart of the proportion of individuals in each status.
status_vals = df.Professional.value_counts()#Provide a pandas series of the counts for each Professional status

# The below should be a bar chart of the proportion of individuals in each professional category if your status_vals
# is set up correctly.

(status_vals/df.shape[0]).plot(kind="bar");
plt.title("What kind of developer are you?");
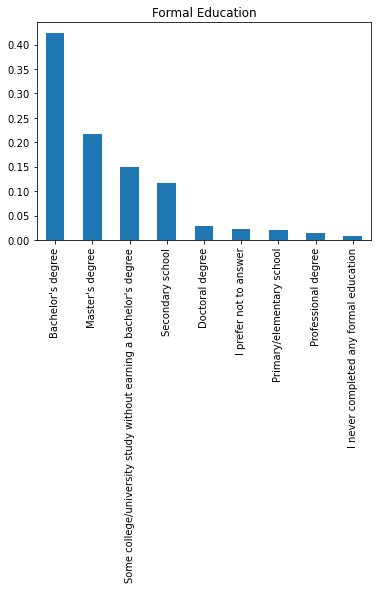
Question 5
- Provide a pandas series of the different FormalEducation status values in the dataset. Store this pandas series in ed_vals. If you are correct, you should see a bar chart of the proportion of individuals in each status.
ed_vals = df.FormalEducation.value_counts()#Provide a pandas series of the counts for each FormalEducation status

# The below should be a bar chart of the proportion of individuals in your ed_vals
# if it is set up correctly.

(ed_vals/df.shape[0]).plot(kind="bar");
plt.title("Formal Education");
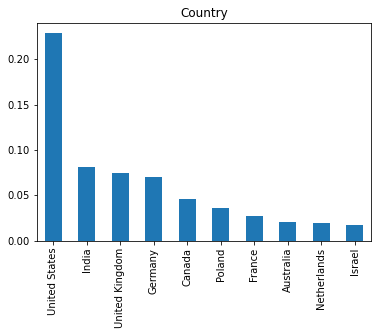
Question 6
- Provide a pandas series of the different Country values in the dataset. Store this pandas series in count_vals. If you are correct, you should see a bar chart of the proportion of individuals in each country.
count_vals = df.Country.value_counts()#Provide a pandas series of the counts for each Country

# The below should be a bar chart of the proportion of the top 10 countries for the
# individuals in your count_vals if it is set up correctly.
(count_vals[:10]/df.shape[0]).plot(kind="bar");
plt.title("Country");
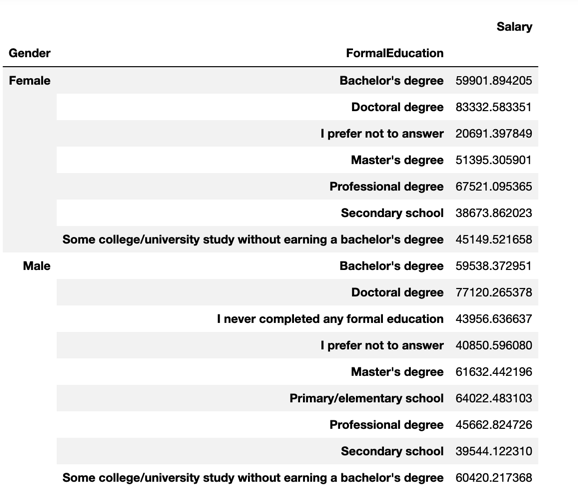
Feel free to explore the dataset further to gain additional familiarity with the columns and rows in the dataset. You will be working pretty closely with this dataset throughout this lesson.
pd.DataFrame(df.query("Professional == 'Professional developer' and (Gender == 'Male' or Gender == 'Female')").groupby(['Gender', 'FormalEducation']).mean()['Salary'])
#myNotes
status_vals = df.Professional.value_counts()#Provide a pandas series of the counts for each Professional status
.value_counts()
在pandas中,value_counts常用于数据表的计数及排序,它可以用来查看数据表中,指定列里有多少个不同的数据值,并计算每个不同值有在该列中的个数,同时还能根据需要进行排序。
函数体及主要参数:
value_counts(values,sort=True, ascending=False, normalize=False,bins=None,dropna=True)
sort=True: 是否要进行排序;默认进行排序
ascending=False: 默认降序排列;
normalize=False: 是否要对计算结果进行标准化并显示标准化后的结果,默认是False。
bins=None: 可以自定义分组区间,默认是否;
dropna=True:是否删除缺失值nan,默认删除
作业笔记结束
🔗回到上一级笔记列表


 1162
1162


 被折叠的 条评论
为什么被折叠?
被折叠的 条评论
为什么被折叠?
 到【灌水乐园】发言


